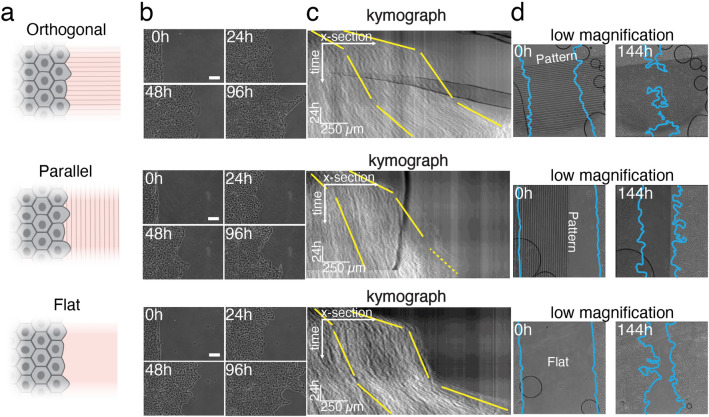
Figure 5.
Migration of the epithelium in wound closure experiment. a Orientation of the wound in comparison to 1 μm topographical features. b Phase contrast images of the wound boundary progression over time. Scale bar 100 μm. c Kymographs of the wound closure (averaged over the entire field) from the phase contrast images. Yellow lines represent the progression of the front and the rear end of the epithelium (defined as 300 μm deep into the wound at the beginning of the process). The wound front in the parallel configuration during the third phase is indicated by a yellow dotted line due to its difficult identification. d Low magnification phase contrast images of the in vitro wound healing during migration on the three samples (flat, orthogonal, and parallel) right after PDMS slice has been peeled off and after 144 h (6 d). Light blue lines define the wound edges.

