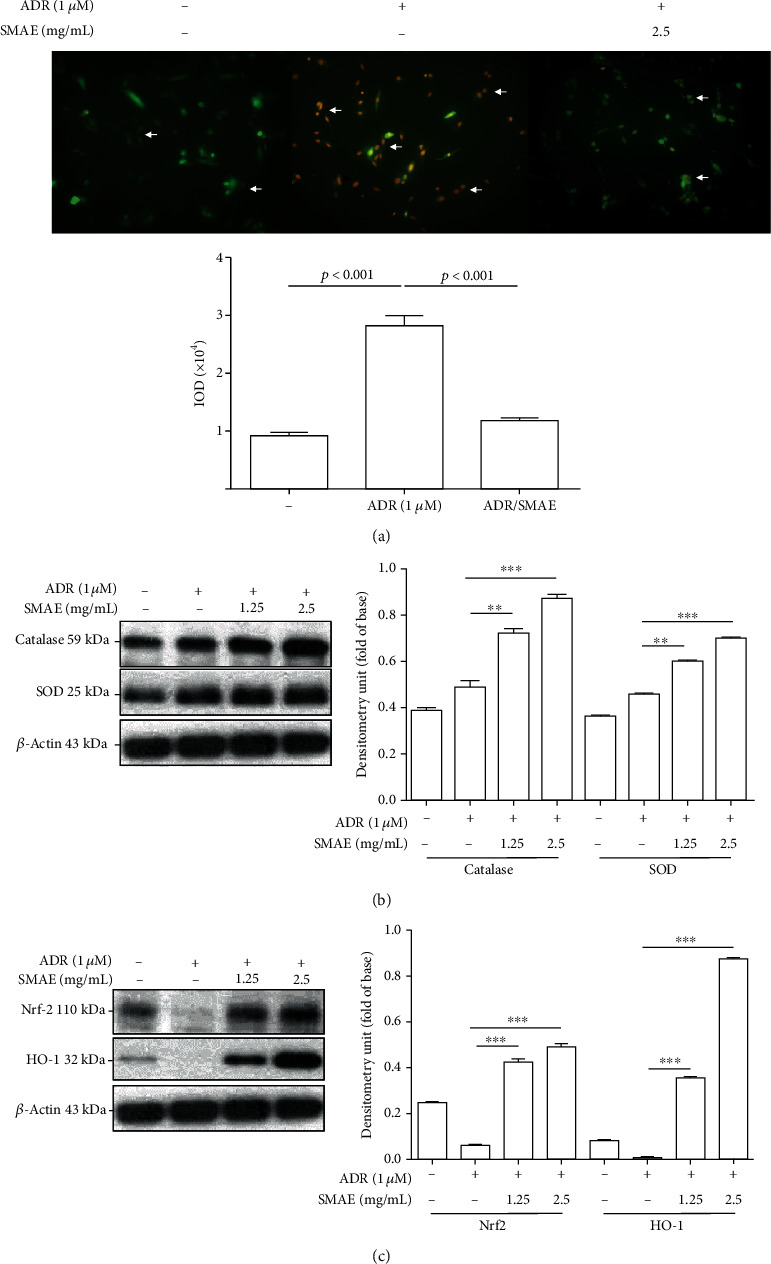
Figure 4.

(a) H9c2 cells were incubated with or without 1 micro M ADR and 2.5 mg/mL SMAE. The DCF fluorescence signal was observed under a fluorescence microscope and demonstrated by arrows. (b) Validation of changes in protein expression after different treatments. Protein levels of catalase and SOD were determined by a Western blot analysis. (c) The expression of Nrf2 and HO-1 was evaluated with Western blot analysis. β-Actin was used as an internal control. The quantified results were indicated by the bar chart and represent the mean ± SD of three independent experiments. (∗∗p < 0.01, ∗∗∗p < 0.001).
