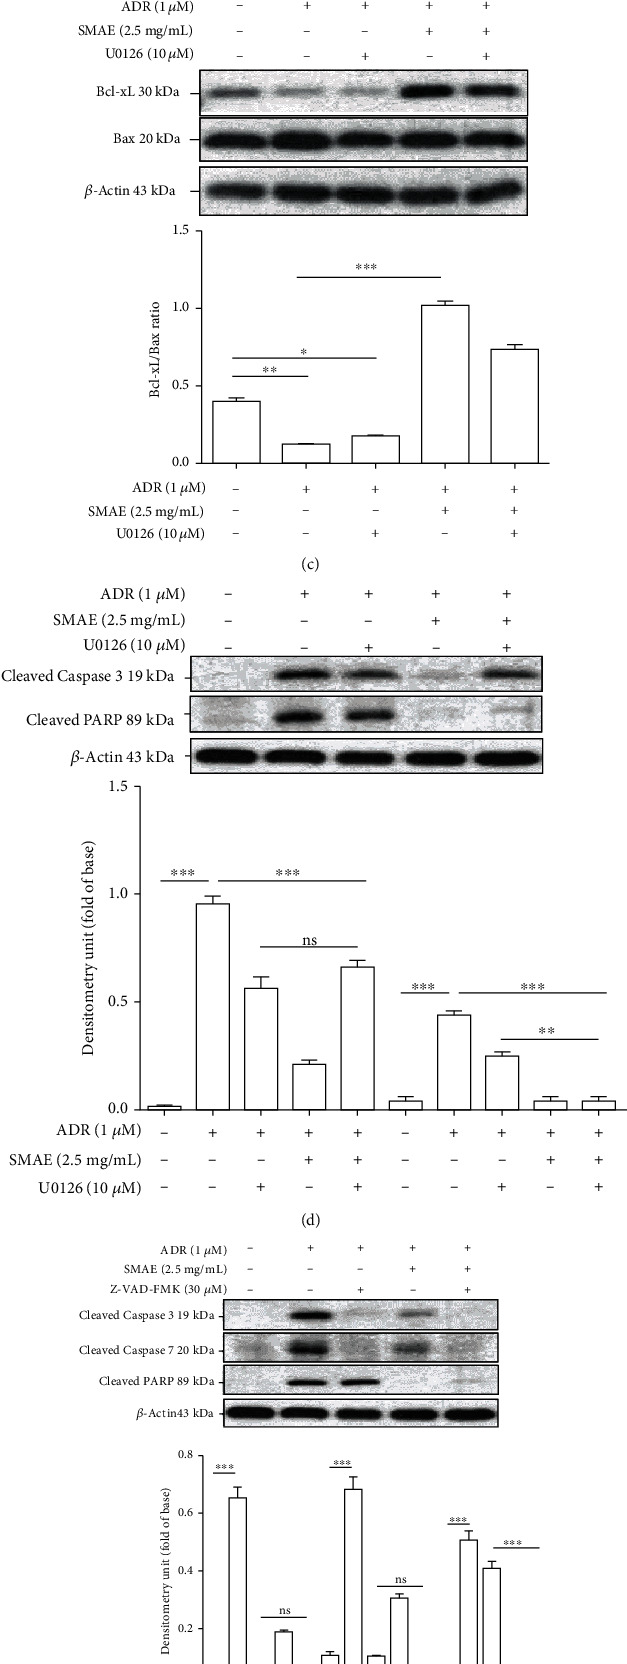
Figure 5.

(a) Western blot analysis for phosphorylation and total protein levels of ERK1/2 and p53 with different treatments. The phosphorylation levels of ERK1/2 and p53 were normalized by total protein levels. Results represent the mean ± SD of three independent experiments (∗∗∗p < 0.001). GAPDH was applied as the loading control. (b) Cells were preincubated with or without U0126 for 0.5 h and then treated with or without ADR and SMAE for 24 h. The phosphorylation levels of ERK1/2 and p53 were normalized by total protein levels. β-Actin was used as an internal control. Results represent the mean ± SD of three independent experiments. (c) The protein levels of Bcl-xL and Bax with or without treatments of U0126, ADR, and SMAE were determined by western blotting assays. Density ratio of Bcl-xL over Bax was measured by densitometer, and β-actin was used as an internal control. The quantified results were indicated by the bar chart. (d) Cleavage of caspase-3 and PARP with or without treatments of U0126, ADR, and SMAE was determined by western blotting assays. β-actin was used as an internal control. The quantified results were indicated by the bar chart. (e) Cleavage of caspase-3 and PARP with or without treatments of Z-VAD-FMK (30 μM), ADR, and SMAE was determined by western blotting assays. β-Actin was used as an internal control. The quantified results were indicated by the bar chart. (f) SMAE efficacy on protection against ADR induced cathepsin B/AIF-mediated apoptosis. The quantified results were indicated by the bar chart. Results represent the mean ± SD of three independent experiments (∗∗∗p < 0.001).
