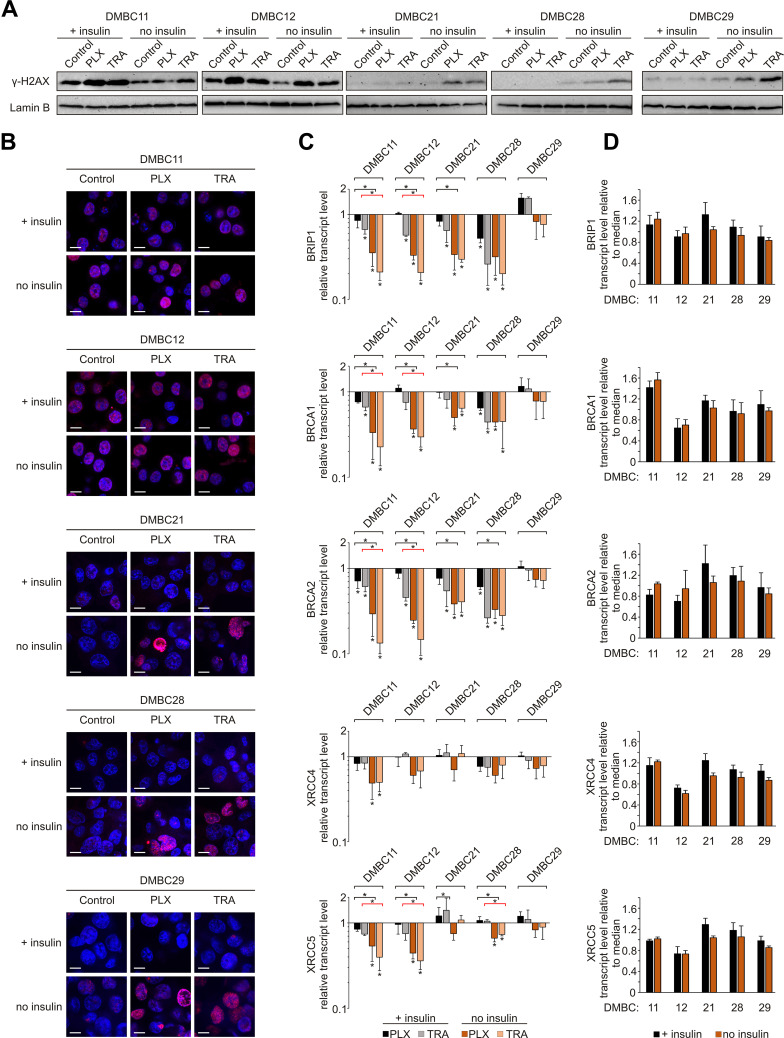
Figure 4.
Insulin attenuates vemurafenib- and trametinib-induced changes in the γ-H2AX level and DNA repair capacity of melanoma cells. (A) Western blot analysis of the H2AX phosphorylation detected in nuclear extracts of control melanoma cells or cells treated with vemurafenib (PLX) or trametinib (TRA) for 12 h, in the presence or absence of insulin. Lamin B was used as a loading control. n=2. (B) Confocal imaging of melanoma cells stained with anti-phospho-H2AX (pink) merged with nuclear counterstain – DAPI (blue) after 12 h of drug treatment. Scale bar=10 µm. n=2. (C) Changes relative to controls in transcript levels of BRIP1, BRCA1, BRCA2, XRCC4 and XRCC5 after 24 h of drug treatment assessed by qRT-PCR and normalized to the expression of a reference gene, RPS17. Bars represent mean values of three independent experiments ± SD. ANOVA and Scheffé’s test were used to calculate statistical significance. Statistical significance marked as asterisks in proximity to each bar refers to the drug-induced difference in relation to control, and as asterisks adjacent to lines above the bars refers to the difference between melanoma cells grown with or without insulin (black lines for PLX-induced differences, red lines for TRA-induced differences). Differences are considered significant at *P<0.05. (D) Transcript levels of BRIP1, BRCA1, BRCA2, XRCC4 and XRCC5 in melanoma cells grown with or without insulin, relative to the median value for all five cell lines.

