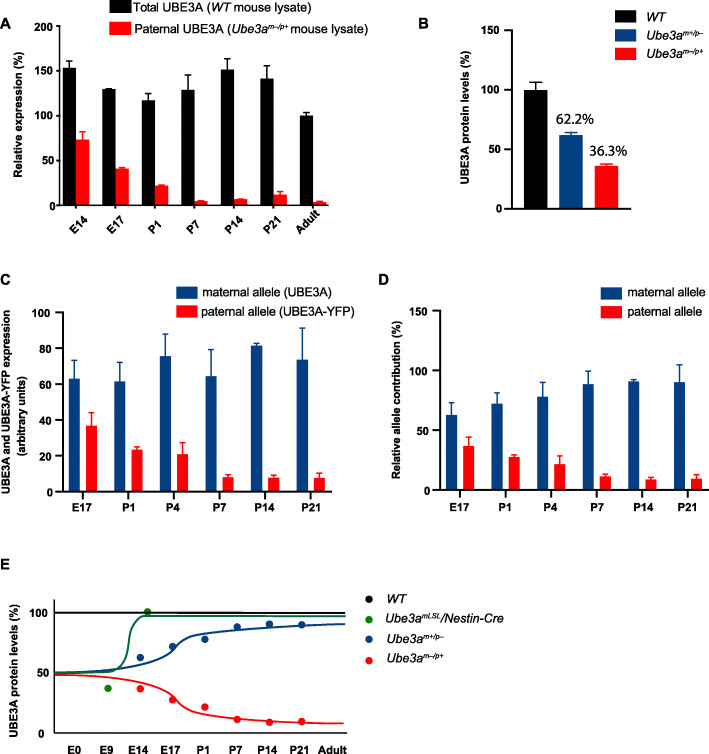
Fig. 3.
Silencing of the paternal Ube3a gene is not completed till after birth. a Total and paternal UBE3A expression during development. UBE3A was quantified upon Western blot analysis of total cortical lysates isolated from WT and AS (Ube3am−/p+) mice at E14 (n = 8,5), E17 (n = 2,2), P1 (n = 6,3), P7 (n = 5,5), P14 (n = 4,3), P21 (n = 3,2), and adult mice (n = 2). Note that despite silencing of the paternal allele (red bars), total UBE3A levels remain rather constant (black bars), suggesting that the expression of the maternal allele increases at the same rate as the silencing of the paternal allele. All values are normalized against UBE3A levels in adult WT mice. Error bars represent mean ± SEM. b Loss of maternal UBE3A expression does not result in upregulation of paternal UBE3A expression. Note that the sum of UBE3A expression in Ube3am−/p+ and Ube3am+/p− mice does not exceed 100%. UBE3A was quantified upon Western blot analysis of total lysates obtained from cortex isolated from WT (n = 5), Ube3am−/p+ (n = 5), and Ube3am+/p− (n = 5) mice at E17. All values were normalized against UBE3A levels in WT mice. Error bars represent mean ± SEM. Absolute (c) and relative (d) expression levels of both alleles during development in Ube3am+/pUBE3A-YFP mice. c UBE3A and UBE3A-YFP signals were determined upon Western blot analysis of total lysates of cortex of Ube3am+/pUBE3A-YFP mice at E17 (n = 3), P1 (n = 2), P4 (n = 3), P7 (n = 3), P14 (n = 3), and P21 (n = 2). To enable direct comparison of both alleles, UBE3A-YFP immunoreactivity values of E17 Ube3am+/pUBE3A-YFP pups were calibrated against the UBE3A values of E17 Ube3am−/p+ pups of b. The relative contribution of each allele was subsequently determined by calculating the contribution of each allele as percentage of both alleles for each time point (d). e Schematic representation of UBE3A levels in WT, Ube3amLSL/Nestin-Cre, Ube3am+/p−, and Ube3am−/p+ mice, indicating that Ube3am+/p− mice can effectively be used as a UBE3A reinstatement model in which UBE3A levels are restored to normal levels after birth. The data points for this figure are based on the Western blots of b and a–d.

