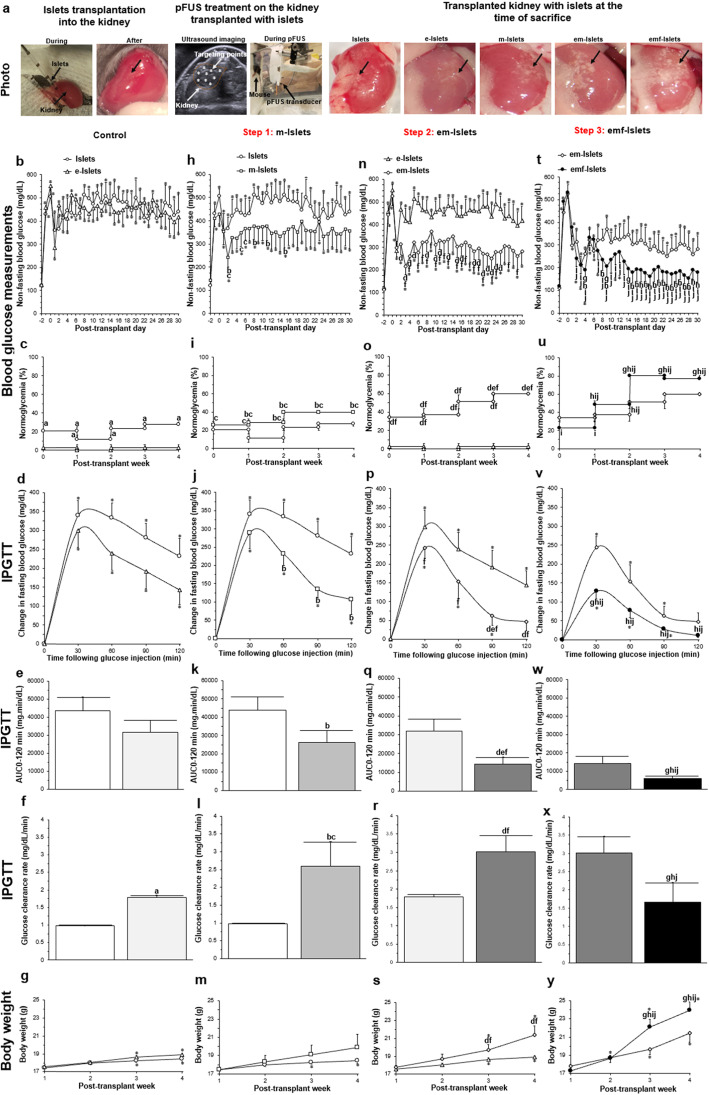
Fig. 4.
In vivo analysis of islet survival and function (metabolic analysis): a islet transplantation using a kidney subcapsular approach; pFUS treatment on the kidney transplanted with islets; transplanted kidney with different experimental groups (i.e., Islets, e-Islets, m-Islets, em-Islets, and emf-Islets) at the time of euthanasia (black arrows indicate transplanted islets); results of b–e BG measurements, f–i normoglycemia percentage, j–m IPGTT, n–q area under the IPGTT curve (AUC0-120min), r–u BG clearance rates calculated from slope of IPGTT curves from 30 to 90 min and v–y body weight of mice post-transplant measured at various time points over 30 days. Results shows the effect of b, f, j, n, r, v islet encapsulation by comparing Islets with e-Islets, c, g, k, o, s, w AD-MSC coating on islets by comparing Islets with m-Islets, d, h, l, p, t, x encapsulating islets with AD-MSCs by comparing e-Islets with em-Islets, e, i, m, q, u, y and pFUS treatment by comparing em-Islets with emf-Islets groups. Significant differences: b–y aP < 0.05: e-Islets vs. Islets; bP < 0.05: m-Islets vs. Islets; cP < 0.05: m-Islets vs. e-Islets; dP < 0.05: em-Islets vs. e-Islets; eP < 0.05: em-Islets vs. m-Islets; fP < 0.05: em-Islets vs. Islets; gP < 0.05: emf-Islets vs. em-Islets; hP < 0.05: emf-Islets vs. m-Islets; iP < 0.05: emf-Islets vs. e-Islets; jP < 0.05: emf-Islets vs. Islets; *P < 0.05: baseline vs. all other time-points (two (b, h, n, t, d, j, p, v, g, m, s, y) or one (k, q, w, l, r, x)-way ANOVA post hoc Tukey test or unpaired Student’s t test (e, f))

