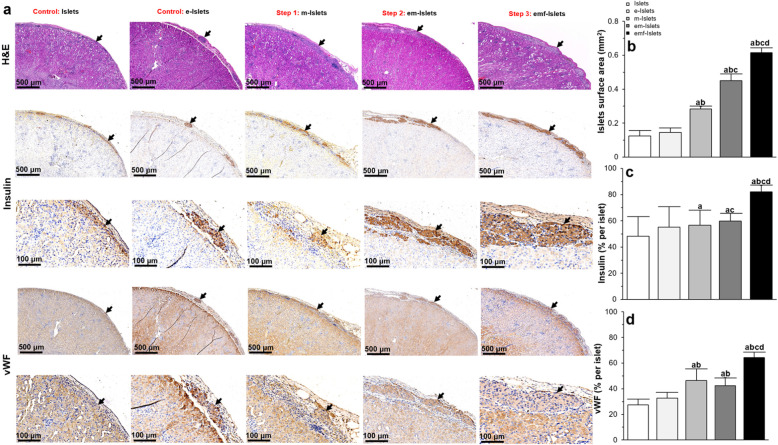
Fig. 5.
In vivo analysis of islet survival and function (histological analysis): a representative images following H&E, insulin, and vWF immunohistochemical staining of islets in tested groups (i.e., Islets, e-Islets, m-Islets, em-Islets, and emf-Islets) that were transplanted under the kidney capsule. Black arrows indicate islets present within the representative images and red arrows indicate blood vessels within the islets; b quantification of surface area occupied by islets; c–e quantification of positive c insulin and d vWF staining. Results were analyzed with at least 15–20 islets from 5 different sections through the kidney of each animal. Significant differences: aP < 0.05: Islets vs. e-Islets or m-Islets or em-Islets or emf-Islets; bP < 0.05: e-Islets vs. m-Islets or em-Islets or emf-Islets; cP < 0.05: m-Islets vs. em-Islets or emf-Islets; dP < 0.05: em-Islets vs. emf-Islets (one-way ANOVA post hoc Tukey test)

