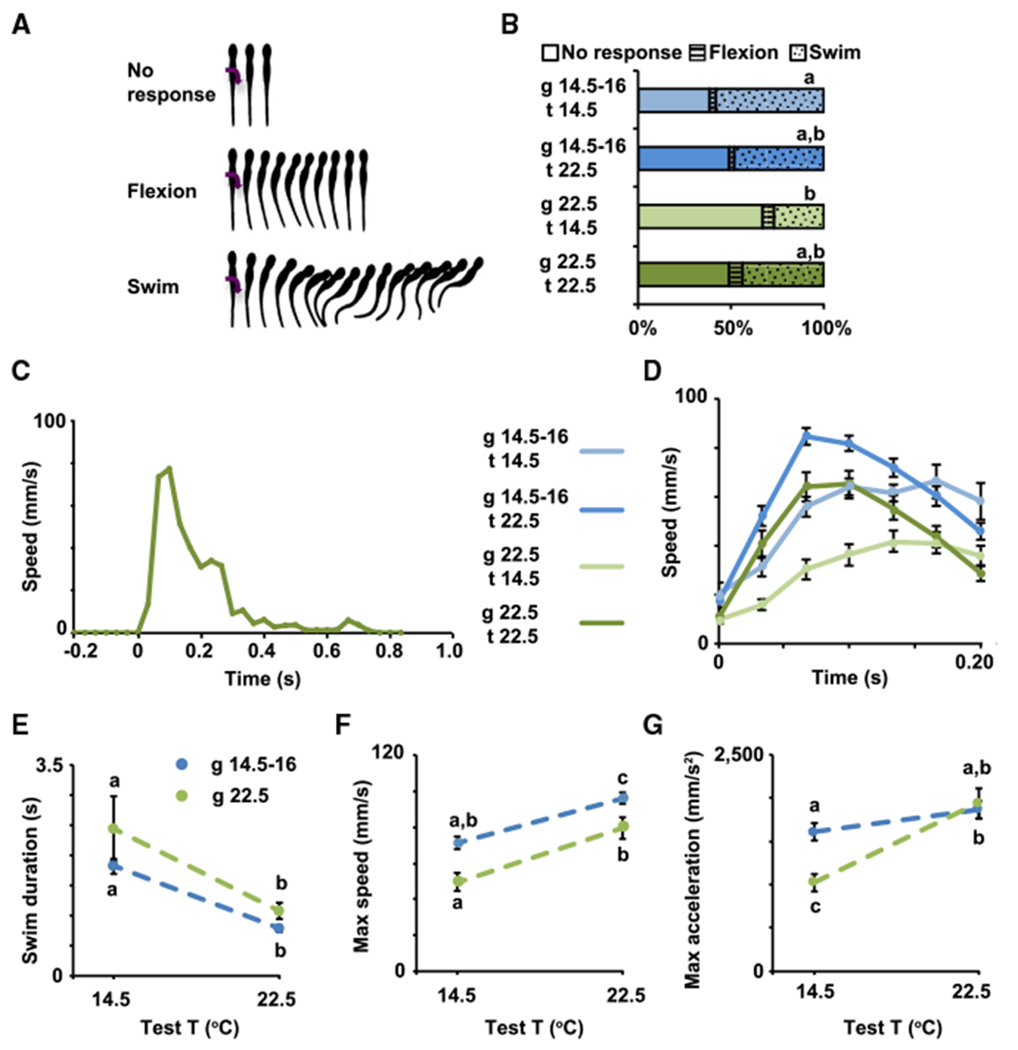
Figure 1. The Temperature of the Environment during Development Influences Early Swimming Behavior in Xenopus laevis Larvae.

(A) Types of behavioral responses to gentle touch; modified from [26, 27].
(B–G) Stage 37/38 (B) and 40 (C-G) larvae grown in cold (blue, 14.5°C-16°C) or warm (green, 22.5°C) temperature were subjected to 20 trials each of gentle touch at cold (14.5°C) or warm (22.5°C) temperature. Responses were video recorded at 30 Hz, n = 6 larvae per condition.
(B) Average percentage of incidence of each response.
(C) Example of full time course of swim speed after gentle touch (0 s) from stage 40 larva grown in and tested at warm temperature.
(D) Time course of changes in speed during initial phase (first 200 ms) of the swim response.
(E) Swim duration.
(F) Maximum speed during initial phase of the swim response.
(G) Maximum tangential acceleration during initial phase of the swim response.
In (D)–(G), data are mean ± SEM. In (B) and (E)–(G), the letters on top of datasets indicate significant (different letters) or not significant (same letters) differences, p < 0.05, 2-way ANOVA, Tukey post hoc test.
