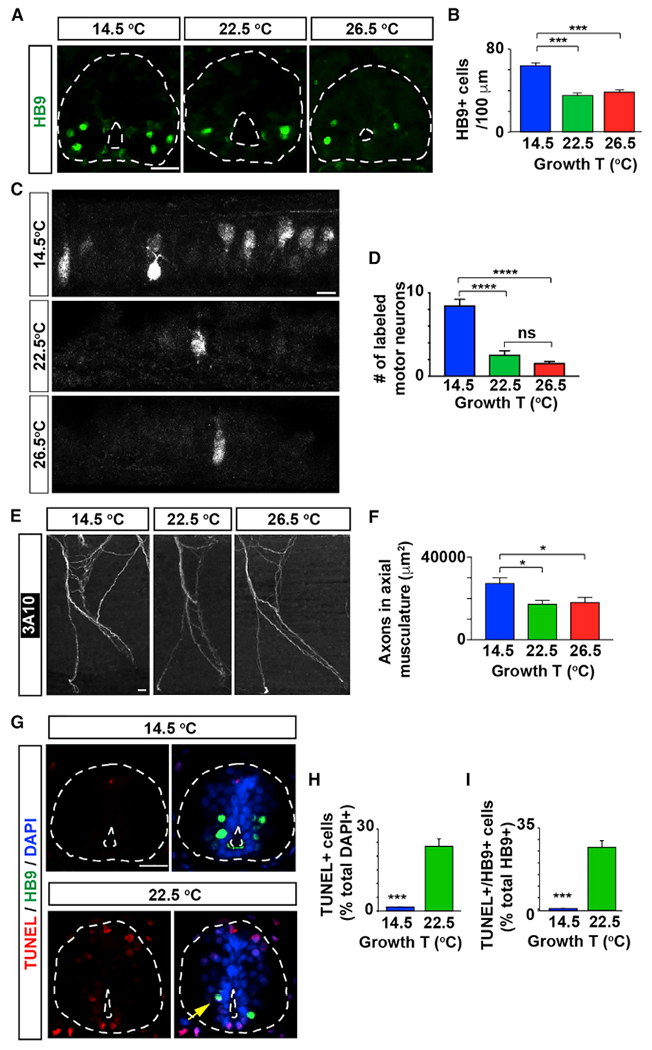
Figure 2. The Number of Spinal Motor Neurons in Developing Larvae Is Temperature Dependent.

(A) Images show cross-sections of immunostained spinal cord (outlined) from stage 40 larvae grown in cold (14.5°C) or warm (22.5 or 26.5°C)temperatures.
(B) Graph shows number of HB9-immunopositive cells per 100 μm of spinal cord; mean ± SEM from at least 220 μm length of spinal cord per larva, n ≥ 4 larvae per condition, ***p < 0.001, 1-way ANOVA, Tukey post hoc test.
(C) Images show maximum intensity projections of whole-mount spinal cord from stage 40 larvae grown in different temperatures followed by retrograde labeling with Alexa 488-dextran conjugate from ventral axial musculature.
(D) Graph shows numbers of retrogradely labeled motor neurons; mean ± SEM for each experimental group, n ≥ 10 larvae per condition, ****p < 0.0001; ns, not significant’ Kruskal-Wallis test’ Dunn’s multiple comparisons test.
(E) Images show maximum intensity projections of whole-mount immunostained axonal bundle #5 (with 1 being the most anterior axonal bundle innervating the axial musculature) with the axonal marker 3A10 (neurofilament associated protein), from stage 40 larvae grown in the indicated temperatures.
(F) Graph shows area labeled per axonal bundles 4 through 7; mean ± SEM for each experimental group, n ≥ 10 larvae per condition, *p < 0.05, 1-way ANOVA, post hoc Tukey test.
(G–I) Larvae grown in cold temperature exhibit fewer apoptotic spinal cord cells and motor neurons.
(G) Images show cross-sections of immuno-stained spinal cord (outlined) from stage 40 larvae grown in different temperatures. Scale bars in (A), (C) , (E), and (G), 20 μm.
(H and I) Graphs show percentage of TUNEL+ (H, per total DAPI-labeled nuclei) and HB9+/TUNEL+ cells (I, per total HB9+ cells) per 100 μm of spinal cord; mean ± SEM from at least 220 μm length of spinal cord per larva, n ≥ 4 larvae per condition, ***p < 0.001, two-tailed t test.
See also Figure S1.
