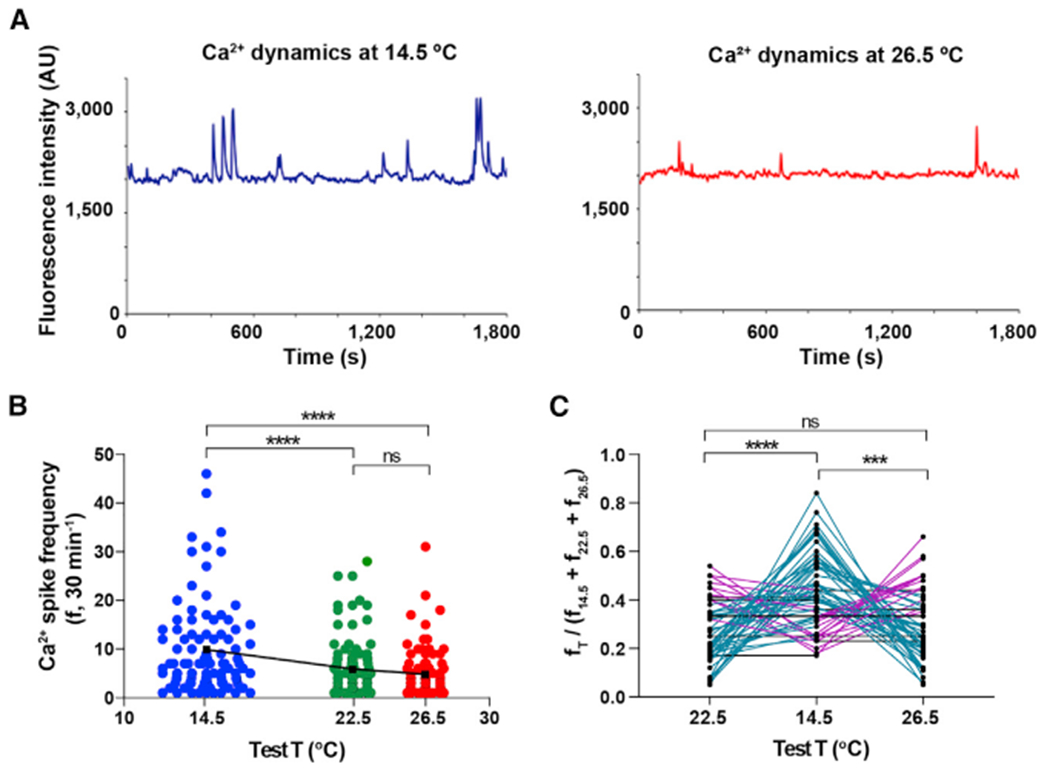
Figure 3. Cold Temperature Acutely Increases Ca2+ Spike Frequency of Embryonic Ventral Spinal Neurons.

Ventral view of spinal cords from stage 24 embryos were Ca2+ imaged for 30-min intervals at 14.5°C, 22.5°C, and 26.5°C ± 0.5°C, in a randomized order.
(A) Traces illustrate the same representative ventral spinal neuron imaged at the indicated temperatures.
(B) Graph shows individual cell and mean (black squares) Ca2+ spike frequency (30 min−1) from N = 4 ventral spinal cords (n of neurons analyzed: 14.5°C, 102; 22.5°C, 104; 26.5°C, 86), ****p < 0.0001; ns, not significant; repeated-measures mixed effect analysis; post hoc Tukey test.
(C) Graph shows ratio of Ca2+ spikes at each temperature compared to the sum of spikes at the 3 temperatures per cell, n = 58. Teal lines represent neurons with higher spike frequency at 14.5°C, magenta lines represent neurons with higher spike frequency at 22.5°C or 26.5°C, and black lines represent neurons with no change in spike frequency across temperatures; ***p < 0.001, ****p < 0.0001; ns, not significant; repeated-measures 2-way ANOVA, post hoc Tukey test.
