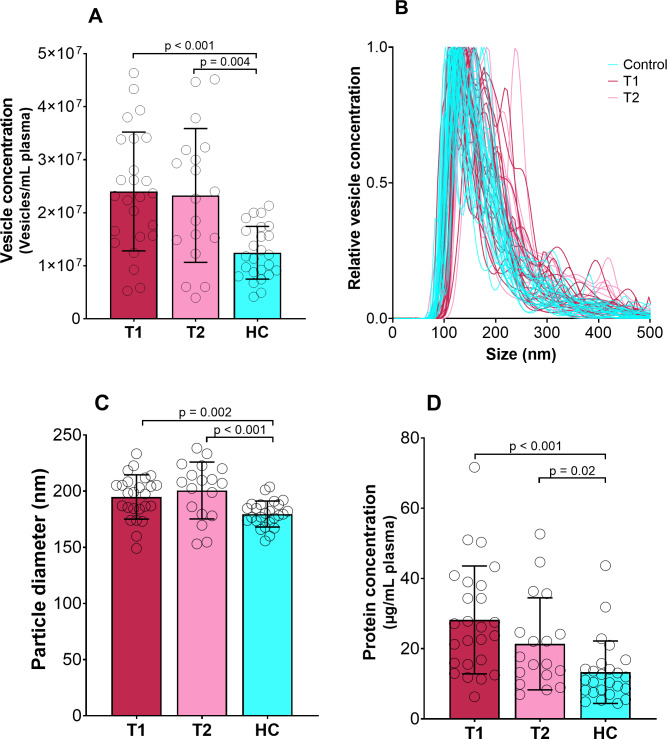
Figure 1. Concentration, size and protein content of EVs.
Vesicle concentration (A), vesicle concentration versus size from nano-tracking analysis (B), vesicle diameter (C) and protein concentration (D) of isolated EV fractions for psychotic patients during psychosis (T1) and in improved state (T2) and healthy controls (HC). P-values are given for significant differences. Bar shows mean value with standard deviation error bars.

