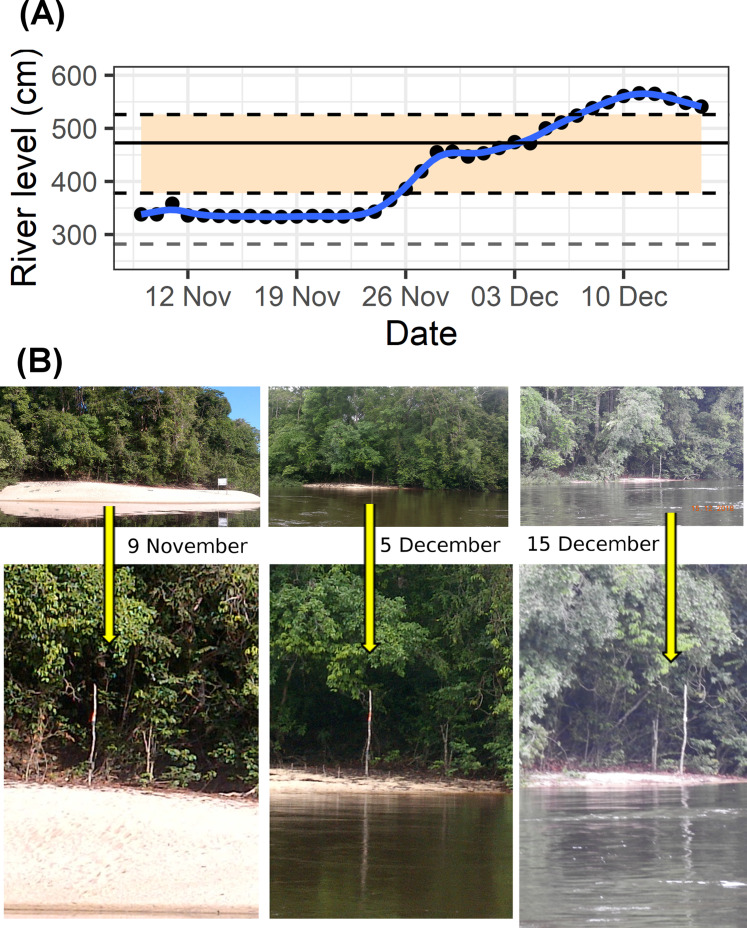
Figure 2. Rapid river level rise.
Illustrating increase in river water level between 9 November and 15 December 2018. (A) Daily river level values (black points) and blue line illustrating trend. Horizontal shaded area spans levels at which 74 Podocnemis unifilis nests were submerged, showing levels corresponding to minimum and maximum nest heights (black dashed lines) and mean nest height (solid horizontal black line). Horizontal gray dashed line shows Y-axis reference river level (the minimum value (282 cm) recorded since records started (22 March 1981)). (B) Riverside photos of one of the highest nesting areas showing changes in river level. Yellow arrows indicate location of the same tree trunk as a reference point.

