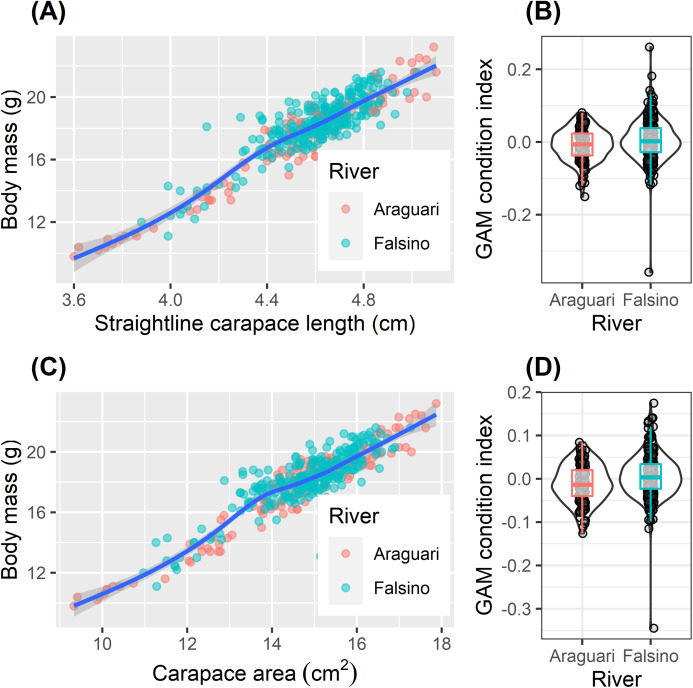
Figure 4. Hatchling condition.
Body size relationships (A and C) and residual body condition indexes (B and D) for Podocnemis unifilis hatchlings released after nest submersion. Body size relationships (A and C) show untransformed values with GAM model trend line to aid visual interpretation. Shaded points show values of from Araguari (red) and Falsino (blue) river hatchlings. Residual body condition indexes (B and D) compared between hatchlings from Araguari and Falsino rivers. GAM condition index is the residuals obtained from modeling the response of ln transformed body mass predicted by two body size indicators (B) ln straight-line carapace length (GAM R2adj = 0.864, Deviance explained = 86.6%) and (D) ln carapace area (GAM R2adj = 0.878, Deviance explained = 88.0%). Violin-plots show density distribution of values, and colored boxplots show median values and the lower and upper hinges corresponding to the first and third quartiles (25th and 75th percentiles).

