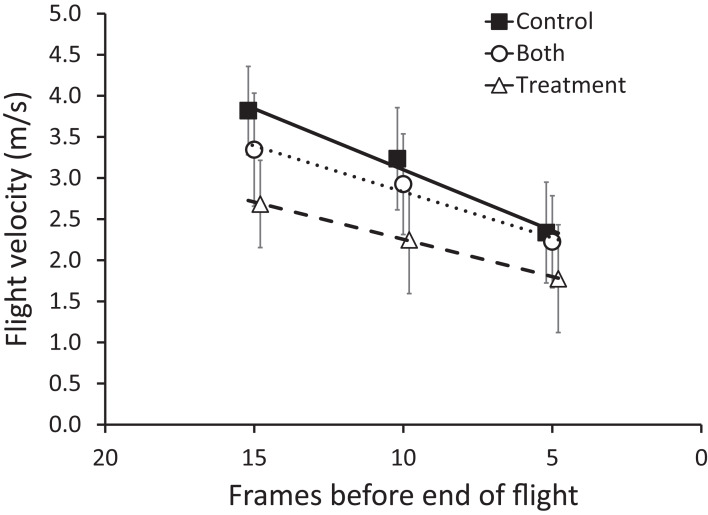
Figure 5. Mean (±95% CI) flight velocity across sequential five frames of flight (15–11, 10–6, 5–1, counting from the end of flight) for zebra finches.
Treatment groups are as follows, control (filled squares), treatment (hollow triangles), and both (hollow circles) trials. Lines connecting points are least-squares lines of best fit. Zebra finches flew approximately 25% slower when the windows were treated with the BirdShades film compared with the control condition.

