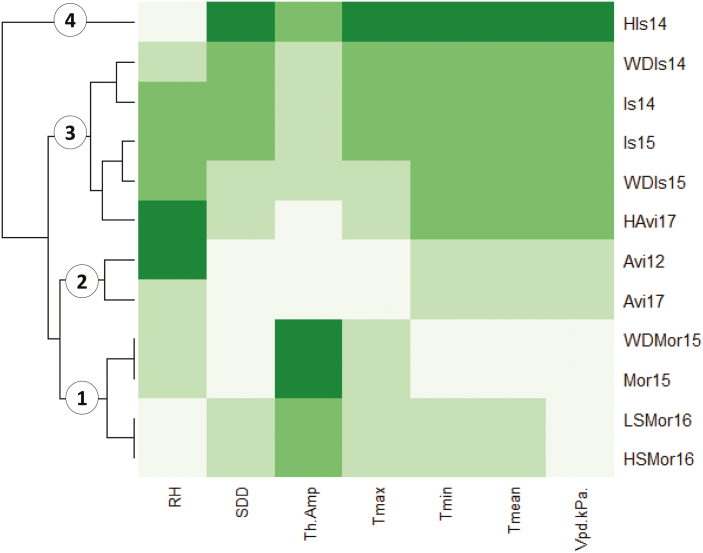
Fig. 1.
Clustering of the experimental environments according to the seven environmental covariates that were measured during the vegetative and flowering stages. RH, relative humidity; SDD, sum of degree-days; ThAmp, thermal amplitude; Tmax, maximum daily temperature; Tmin, minimum daily temperature; Tmean, mean daily temperature; Vpd.KPa, vapour-pressure deficit. The identifiers for the different environments are listed in Supplementary Table S1.

