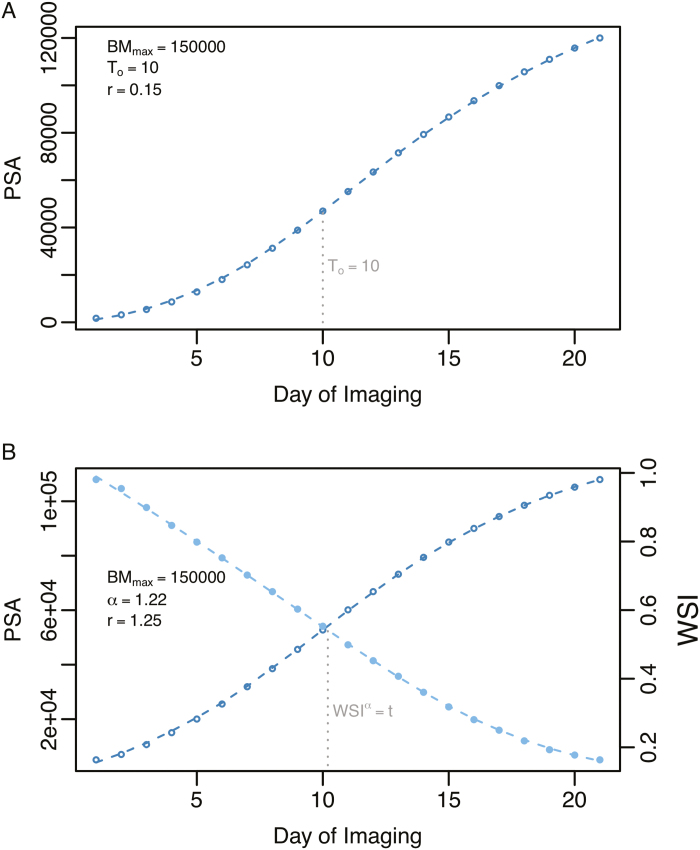
Fig. 1.
Graphical representation of the classical Gompertz model and the WSI-Gomp model. (A) The classical Gompertz growth model was used to generate PSA values over a 21 d period. The parameter values used are provided in the top left corner of the plot. The gray, vertical broken line indicates the inflection point (T0). (B) The WSI-Gomp growth model was used to generate PSA values over a 21 d period. PSA values are shown using dark blue points and a broken line. The light blue points and line indicate the WSI values over the 21 d period. WSI was calculated from simulated soil water content values that are typically of those experienced by water-stressed plants in the current study. The gray, vertical broken line indicates the inflection point (T0).

