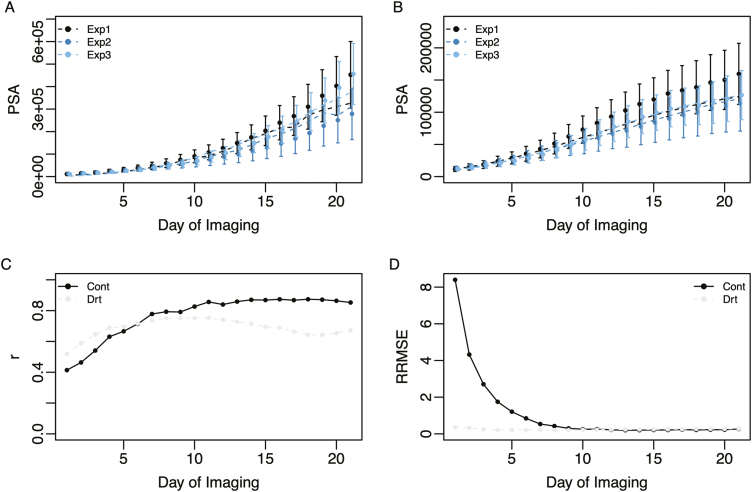
Fig. 3.
Capturing shoot growth trajectories using the WSI-Gomp model. Observed (points) and predicted (broken line) mean shoot growth trajectories for each experiment under control (A) and drought (B) conditions. For both (A) and (B), Nelder–Mead optimization was used to fit the WSI-Gomp model to the mean shoot growth trajectories for each experiment. (C) Average correlation between predicted trajectories and observed PSA values. (D) Relative root mean squared error (RRMSE) between predicted trajectories and observed PSA values. RRMSE was calculated as RMSE at time t divided by the mean predicted values at time t. For both (C) and (D), the WSI-Gomp model was fit using the hierarchical Bayesian model, and predicted PSA values were compared at each time point with observed values for each accession.

