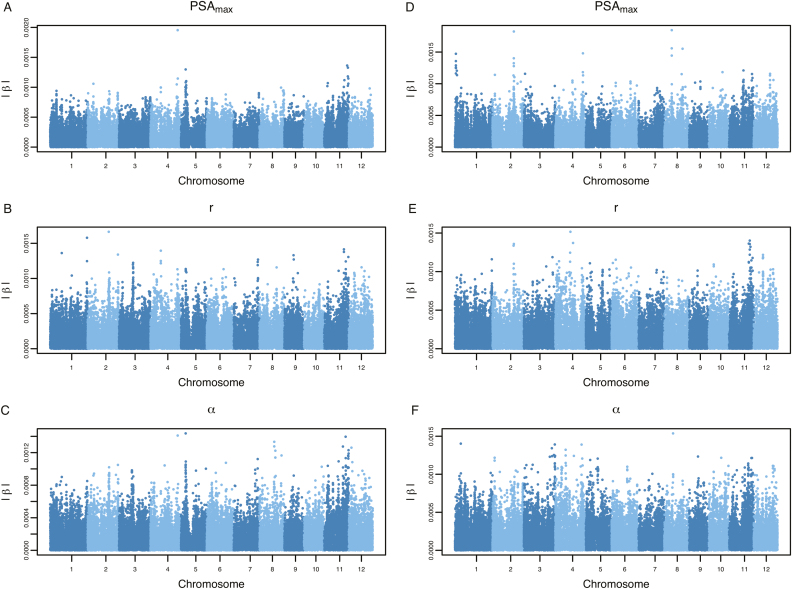
Fig. 5.
Genomic regions influencing model parameters. Predicted marker effects are shown for each of the WSI-Gomp model parameters. (A–C) Marker effects for model parameters fit to growth trajectories in control conditions; (D–F) marker effects for drought conditions. The absolute value of predicted marker effects (|β|) is shown on the y-axis.

