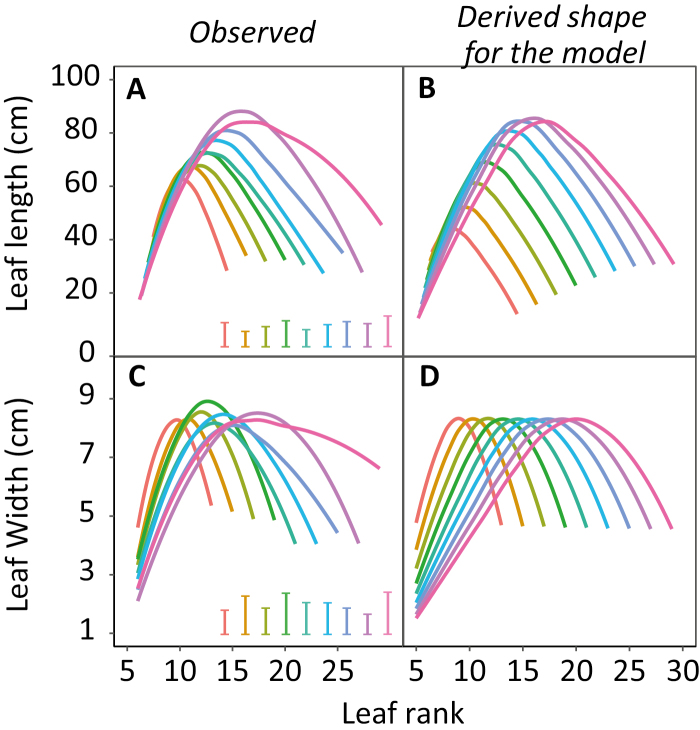
Fig. 2.
Distributions of final leaf length and width along leaf ranks for 127 maize lines with contrasting final leaf numbers, grown in five field experiments (dataset B). Each colour represents the average profile corresponding to lines with a common final leaf number in five sites. (A and C) Observed values; (B and D) distributions derived from the parameters BL and GL (Equation 11, Box 1) calculated from experimental data, for lines with each leaf number. Error bars show the average SDs for each group.

