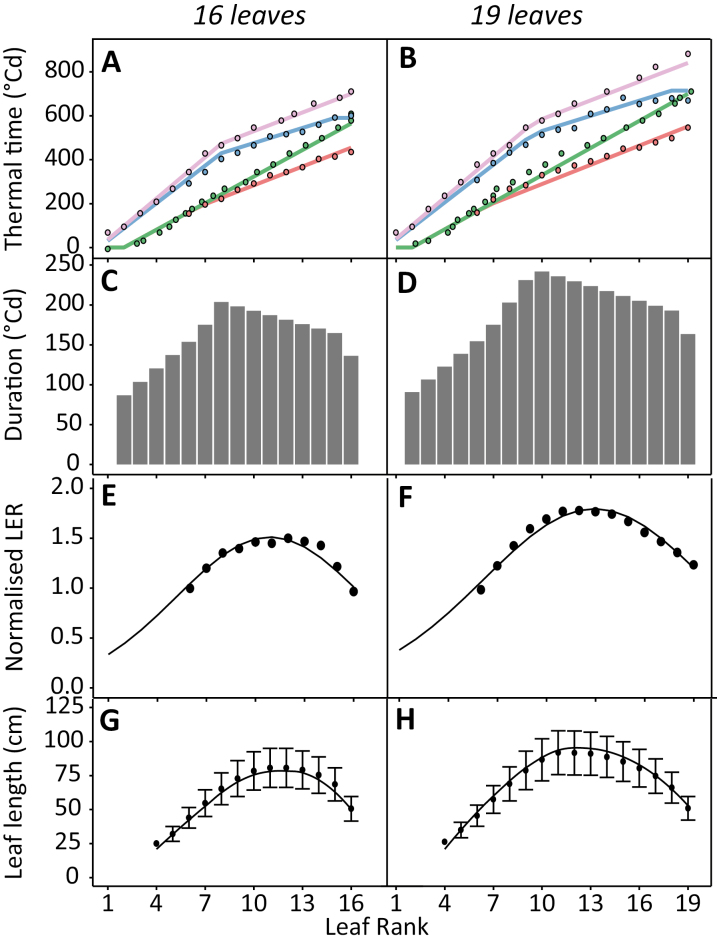
Fig. 4.
Thermal time to reach developmental stages (A, B), duration of leaf expansion (C, D), normalized leaf elongation rate (LER; E, F), and final leaf length (G, H) for two maize hybrids with different flowering time and final leaf number (Déa, 16 leaves; Volga, 19 leaves; Dataset A, Table 1). (A and B) Thermal time from emergence to beginning of linear expansion (red line), leaf tip appearance (green), end of linear expansion (blue), and ligule appearance (purple) as a function of leaf rank. Points, experimental data; lines, model. (E and F) Leaf elongation rate normalized by that of leaf 6. Each dot shows the mean value of 10 plants. The line is the fit with Equation 10. (G and H) Final leaf length. Each dot is the average of 10 plants ±SD. The line is the prediction by the model.

