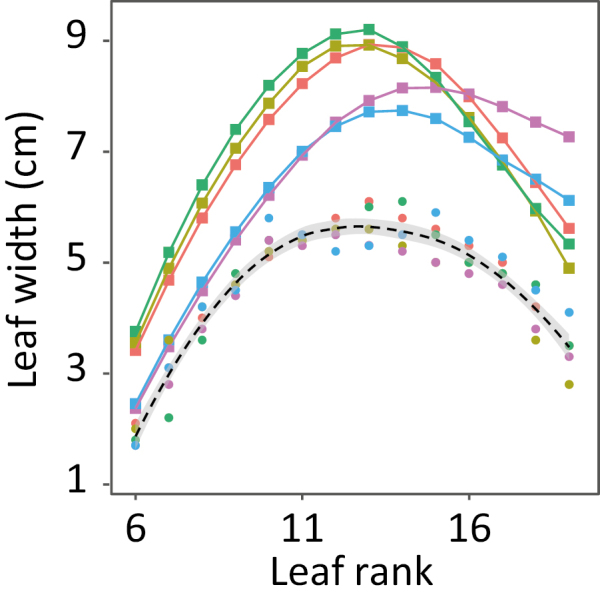
Fig. 5.

Averaged profiles of final leaf width for lines presenting a final leaf number of 19 in five field experiments with contrasting light intensity (Dataset B, Table 1). Squares, observed values measured in Mauguio (red), Nerac (light green), Le Magneraud (green), Tlaltizapan (blue), and Kiboko (pink). Circles represent the calculated width for an intercepted light of 1.5 MJ m–2 d–1 during the period of widening of the corresponding leaf; that is, removing the effect of intercepted light from observed data. Dashed line, overall profile fitted by the smoothing function loess() of R (span=0.65). Grey shading shows the confidence interval.
