Fig. 6.
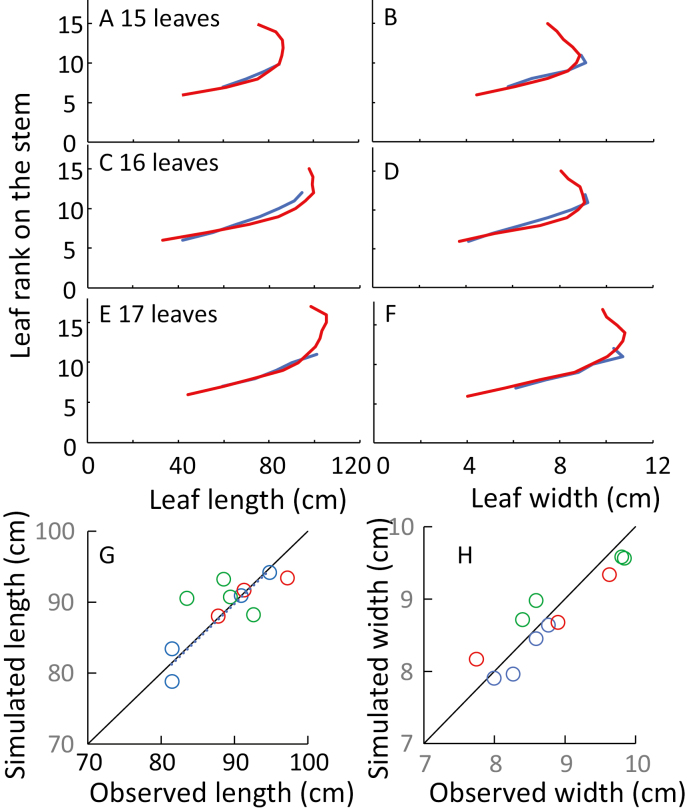
Distributions of leaf length and width along leaf ranks on the stem, and observed versus simulated leaf length and width. (A, C, and E) Leaf length, simulated (red) or measured (blue); (B, D, and F) leaf width. (A and B) Hybrid F252_H with a final leaf number of 15; (C and D) hybrid B73×UH007 with a final leaf number of 16; (E and F) hybrid B104_H with a final leaf number of 17. (G) Observed versus simulated lengths for all hybrids, mean values for leaves 9–11. (H) Observed versus simulated widths, mean values for leaves 9–11. In (G) and (H), blue, green, and red indicate plants with a final leaf number of 15, 16, and 17, respectively; black lines are the 1:1 line. In (G), r2=0.58; in (H), r2=0.87.

