Fig. 1.
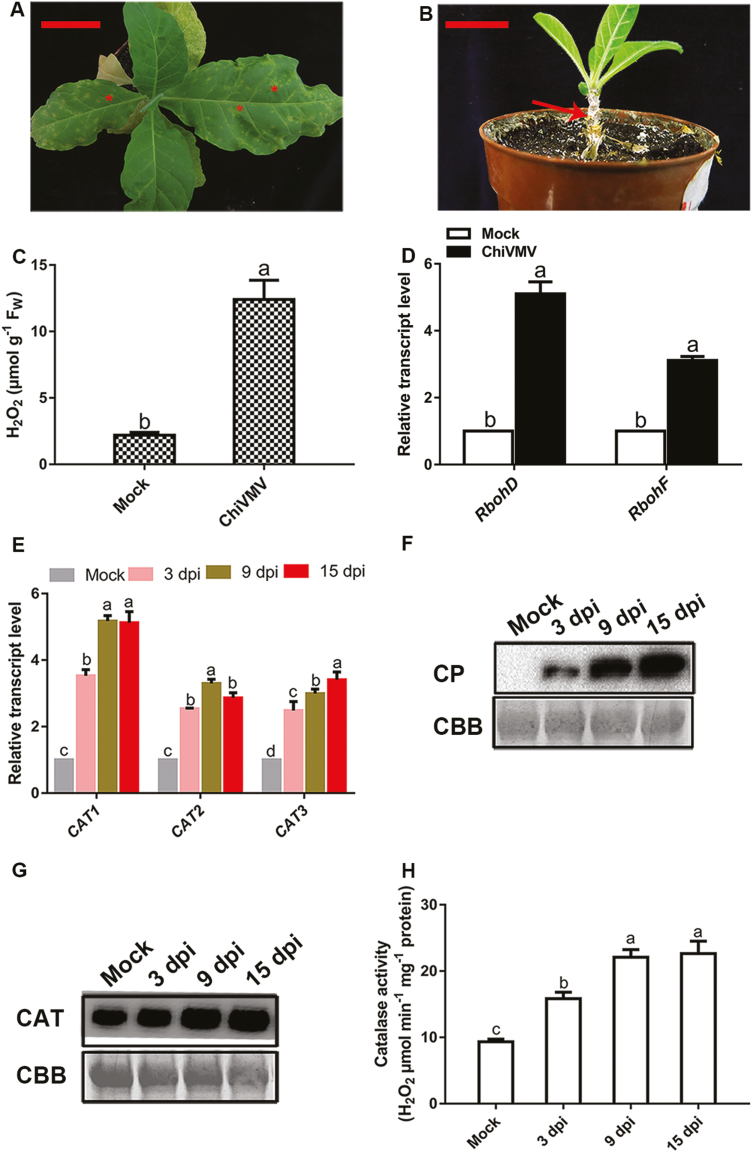
The symptoms of ChiVMV infection on N. tabacum. Symptoms of ChiVMV-infected plants at (A) 20 dpi and (B) 40 dpi. Scale bars=5 cm (left panel) and 2.5 cm (right panel). The asterisk indicates the necrotic spot on the leaf and the arrow points to necrosis of the stem. (C) The content of H2O2 was measured at 9 dpi. (D) qPCR analysis of RbohD and RbohF expression levels at 9 dpi. (E) The transcript levels of catalase genes at 3, 9, and 15 dpi. (F) Coat protein (CP) of ChiVMV accumulated at 3, 9, and 15 dpi. (G) Western blotting analysis of catalase protein in leaves at 3, 9, and 15 dpi. (H) Catalase activity was measured in mock- and ChiVMV-infected plants. Rubisco proteins were used as loading controls, and were stained using Coomassie brilliant blue (CBB). Systemically infected leaves were collected for detection. Values are means and SDs from three biological replicates per genotype and time point. Lower case letters indicate statistically significant differences (P<0.05).

