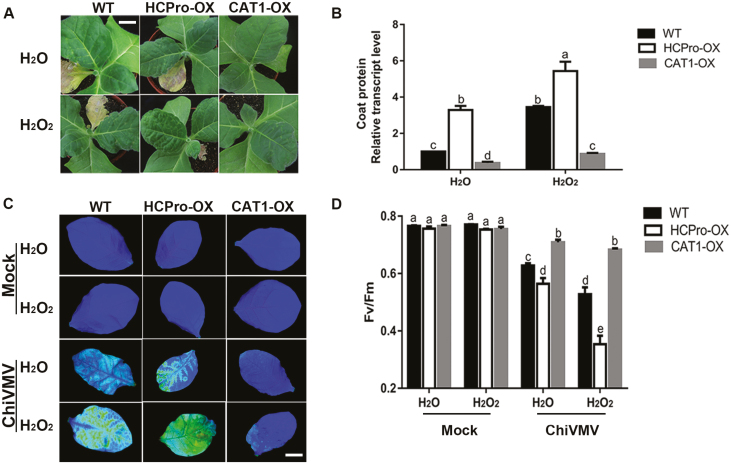
Fig. 7.
Pre-treatment with H2O2 increased susceptibility of plants to ChiVMV infection. (A) Symptoms of the ChiVMV-infected WT, HCPro-OX, and CAT1-OX plants with H2O2 or H2O pre-treatment at 9 dpi. Scale bars=2 cm. (B) Detection of virus accumulation in ChiVMV-infected WT, HCPro-OX, and CAT1- OX plants with H2O2 or H2O pre-treatment at 9 dpi by qPCR analysis. (C) Images of the maximum PSII quantum yield (Fv/Fm) in WT, HCPro-OX, and CAT1-OX plants with H2O2 or H2O pre-treatment at 9 dpi. (D) Average values of Fv/Fm for the respective chlorophyll fluorescence images. Ten plants were used for each treatment, and a picture of one representative leaf is shown. Systemically infected leaves were collected for detection. Bars represent the mean and SD of values obtained from six independent plants. Significant differences (P<0.05) are denoted by different lower case letters.

