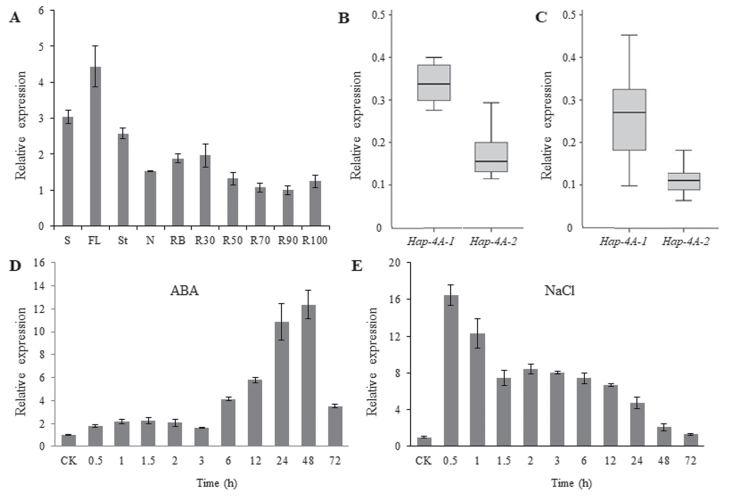
Fig. 5.
Expression patterns of the wheat TaSDIR1-4A haplotypes Hap-4A-1 and Hap-4A-2. (A) Expression patterns of TaSDIR1-4A in different tissues of cv. H10 plants as measured by real-time PCR. S, spikes at flowering; FL, flag leaves; St, stems; N, nodes; RB, root bases; R30, roots from 0–30 cm depth; R50, roots from 30–50 cm; R70, roots from 50– cm; R90, roots from 70–90 cm; R100, roots from 90–100 cm. The values are relative to R90, which was set as 1. (B, C) Expression of Hap-4A-1 and Hap-4A-2 in (B) Population 1 and (C) Population 2. For each haplotype 12 accessions were randomly selected for measurement. (D) Expression patterns of TaSDIR1-4A following ABA treatment. Seedlings of cv. H10 at 2 weeks old were sprayed with 50 μM ABA solution and were sampled at 0 h (control, CK) and at 0.5–72 h. Expression is relative to the value in the control, which was set as 1. (E) Expression patterns of TaSDIR1-4A following NaCl treatment. Seedlings of cv. H10 at 2 weeks old were treated with 250 mM NaCl and were sampled at 0 h (CK) and at 0.5–72 h. Expression is relative to the value in the control, which was set as 1. In all cases GAPDH was used as the internal control. All data are means (±SE) of three biological replicates.

