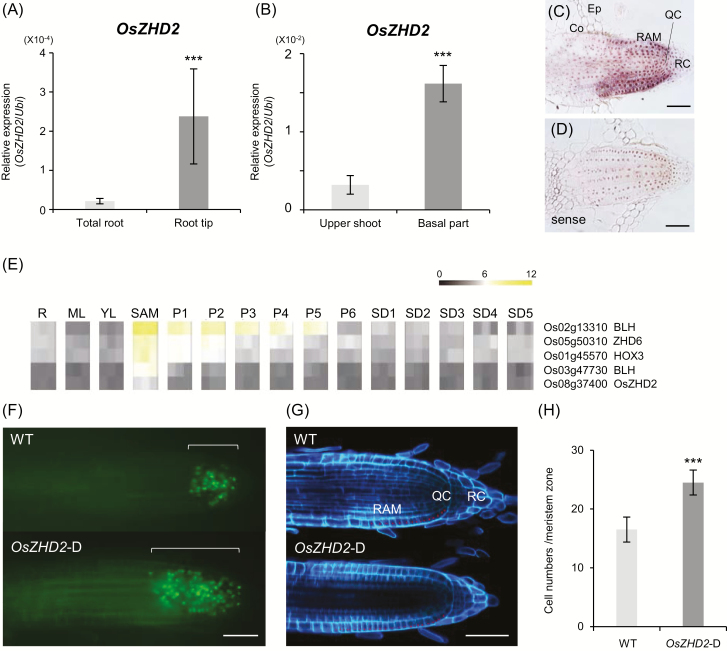
Fig. 2.
Expression patterns of OsZHD2 in the meristem regions and OsZHD2-D meristem activity. (A) Expression levels of OsZHD2 for whole roots and the root tip zone. (B) Expression levels of OsZHD2 at the upper shoot and basal parts (0.5 cm from the bottom). (C and D) RNA in situ hybridization of OsZHD2 with antisense (C) and sense (D) probes. Co, cortex; Ep, epidermis; QC, quiescent center; RAM, root apical meristem regions. RC, root cap. Scale bars=50 µm. (E) Heatmaps of SAM-preferential homeobox gene expression. R, root; ML, mature leaf; YL, young leaf; SAM, shoot apical meristem; P1–P6, developing panicle; SD1–SD5, developing seeds. (F) S-phase entry of lateral root tips visualized using EdU staining from 8-day-old WT (upper) and OsZHD2-D plants (lower). Scale bar=100 μm. (G) Autofluorescence images obtained from transverse sections of the WT (upper) and OsZHD2-D (lower) at root tip zones in lateral roots. Red dots indicate epidermal cells in the meristematic region. Scale bar=50 µm. (H) Average numbers of epidermis cells in the root meristem regions. Error bars show the SD. n=7. Statistical significance is indicated by *** (P<0.001).

