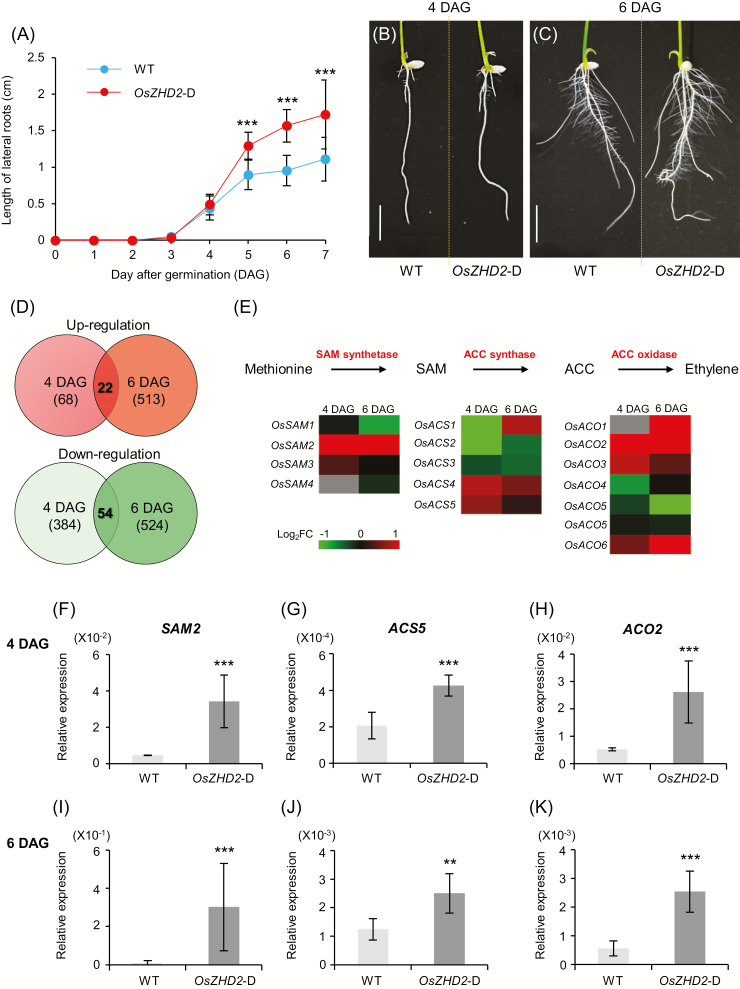
Fig. 4.
RNA-sequencing analysis and qRT-PCR analysis of differentially expressed genes in roots. (A) Rates of lateral root growth for WT and OsZHD2-D plants grown under hydroponic culture conditions. (B and C) Phenotypes at 4 DAG (B) and 6 DAG (C). Scale bar=1 cm. (D) Numbers of up-regulated genes (red) and down-regulated genes (green) in OsZHD2-D roots. (E) Expression levels of ethylene biosynthesis genes. Red, genes up-regulated in OsZHD2-D; green, genes down-regulated in OsZHD2-D; gray, genes either not affected or undetected in RNA-Seq. (F–K) Expression levels of ethylene biosynthesis genes in roots at 4 DAG (F–H) and 6 DAG (I–K). Rice ubiquitin 1 (Ubi1) served as an internal control. Error bars show the SD. n=4. Statistical significance is indicated by ** (P<0.01) and *** (P<0.001).

