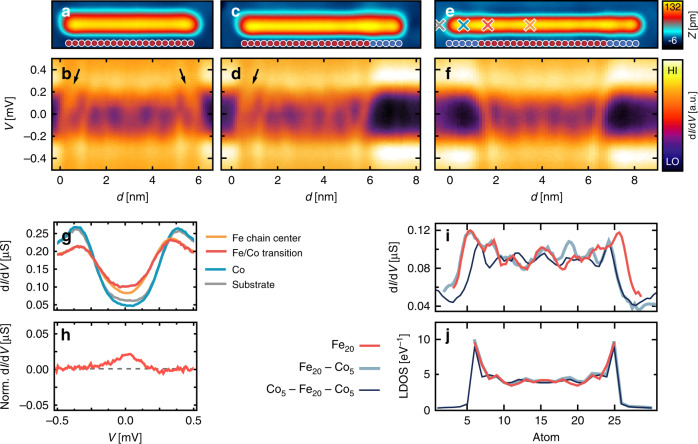
Fig. 4. In-gap states of the Fe20 chains without and with Co5 termination.
a Constant-current scanning tunneling microscope (STM) image of the Fe20 chain. b Differential tunneling conductance along the Fe20 chain aligned with the topography in (a). c Constant-current STM image of the Fe20–Co5 chain. d Differential tunneling conductance along the Fe20–Co5 chain. e Constant-current STM image of the Co5–Fe20–Co5 chain. f Differential tunneling conductance along the Co5–Fe20–Co5 chain. Arrows in (b, d): see text. g dI/dV spectra of the Co5–Fe20–Co5 chain taken at the positions marked by crosses in (e) (Vstab = 1 mV, Istab = 0.2 nA, and Vmod = 20 µV). h dI/dV spectrum from (g) taken at the Fe/Co transition and normalized by subtraction of a spectrum averaged along the chain’s interior. i Experimental zero-bias dI/dV signal along the three different chains as indicated left of (j) extracted from (b, d, f). j Spectral weight at the Fermi energy along the three different chains as indicated on the left, calculated from the tight-binding model. The tight-binding model parameters, except for Δ, are extracted from the ab initio calculations (“Methods” and Supplementary Notes 4 and 5). Δ is chosen as to reproduce the experimentally observed spatial decay of the zero-bias spectral weight from the termination of the spin chain toward the chain center.

