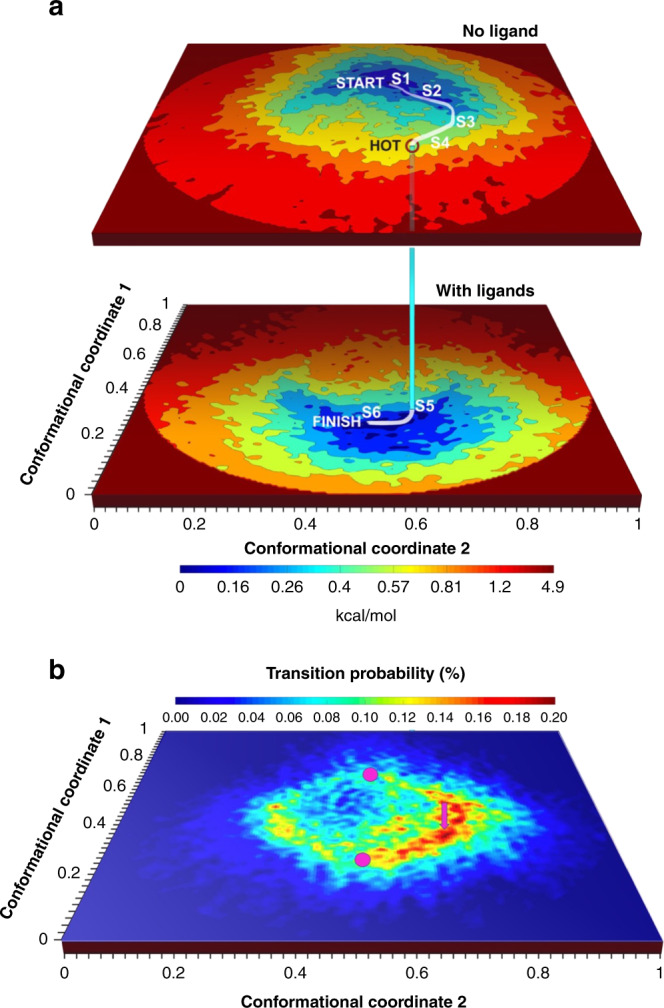
Fig. 1. Energy landscapes with and without ligands, and transition probability map.

a Energy landscapes without ligands (upper surface), and with ligands (Ca2+, ATP, and caffeine) (lower surface). The landscapes are described in terms of the most important two of a common set of orthogonal conformational coordinates. The curved path represents a high-probability route to the binding of ligands. This path starts at the minimum-energy conformation of RyR1 without ligands (“START”), follows the conduit of lowest energy to a point with a high probability of transition to the with-ligands energy landscape (“HOT”), and terminates at the minimum-energy conformation with ligands (“FINISH”). Six representative conformational states along the path, in white, are selected for validation with molecular dynamics simulations (S1–S6). b Probability map for transitions from the energy landscape without ligands to the energy landscape with ligands. The axes are the same as in Fig. 1a, with magenta discs indicating the positions of the minima of the energy landscapes. The magenta arrow indicates the position of the transition point.
