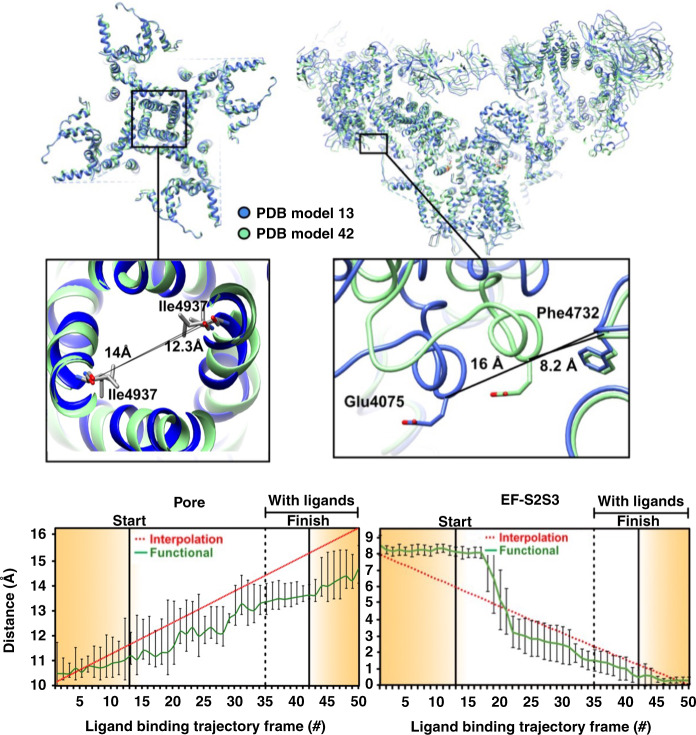
Fig. 4. Conformational changes in the pore and EF-hand domains along the augmented functional path.
The general region and the specific sites (insets) are examined in detail. Distance variations between two amino acid backbones: in the pore measured at Ile4937 (left); and between EF hand (EF) at Glu4075 and S2S3 domain at Phe4732 (right). The amino acids used for measurement are represented as sticks, the rest of the molecule in blue ribbon for the model corresponding to “START” in Fig. 1a, and in green ribbon for model corresponding to “FINISH”. Error bars represent the full scatter (not standard deviation) of the results obtained with six different starting models.

