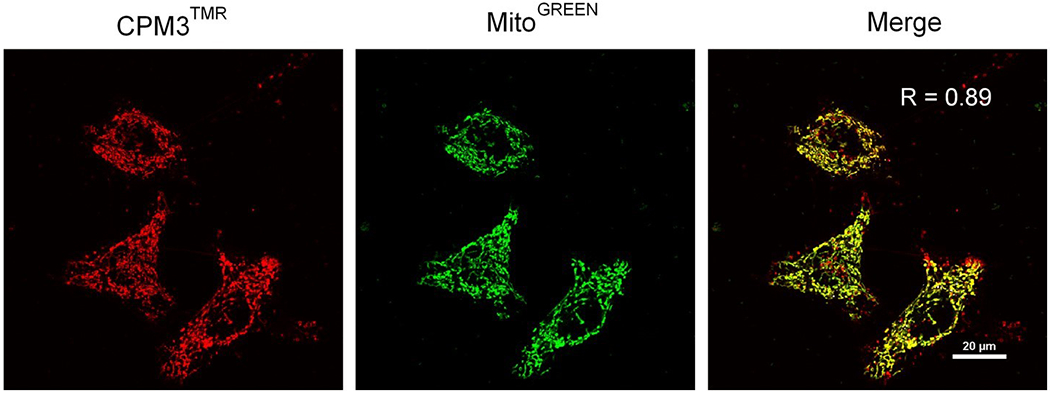
Figure 4.

Live-cell confocal microscopic images of HeLa cells after treatment with 2 μM CPM3TMR for 2 h (red) and incubation with MitoTracker Green for 15 min (green). A merged image is shown on the right with the R value representing Pearson’s correlation coefficient for co-localization. This figure was reproduced from Appiah Kubi et al. (2018) with permission.
