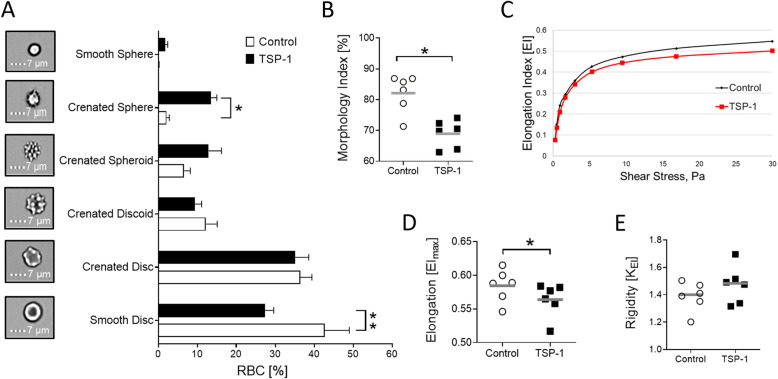
Fig. 4.
Effect of thrombospondin-1 on morphology and deformability of human red blood cells. Means ± SEM showing distribution of RBC morphology (n = 6; a) following a 48-h incubation at 37 °C in Ringer’s solution in the absence (Control) or presence of TSP-1 (50 μg/mL). RBC morphology was assessed using Bright Field images from ImageStream X MkII (60x magnification). Morphology index (n = 6; b) following a 48-h incubation of RBCs at 37 °C in the absence (Control) or presence of TSP-1 (50 μg/mL). c Representative deformability curve (for RBCs from a single donor) of untreated (Control; black line) and TSP-1-treated (red line) RBCs obtained from LORRCA prior to Eadie-Hofstee linearization. Maximum elongation index (EImax; n = 6; d) and rigidity (KEI; n = 6; e) following a 48-h incubation of RBCs in the absence (Control) or presence of TSP-1 (50 μg/mL). * and ** indicate significant difference (P < 0.05 and P < 0.01, respectively) from the absence of TSP-1. Gray lines indicate means

