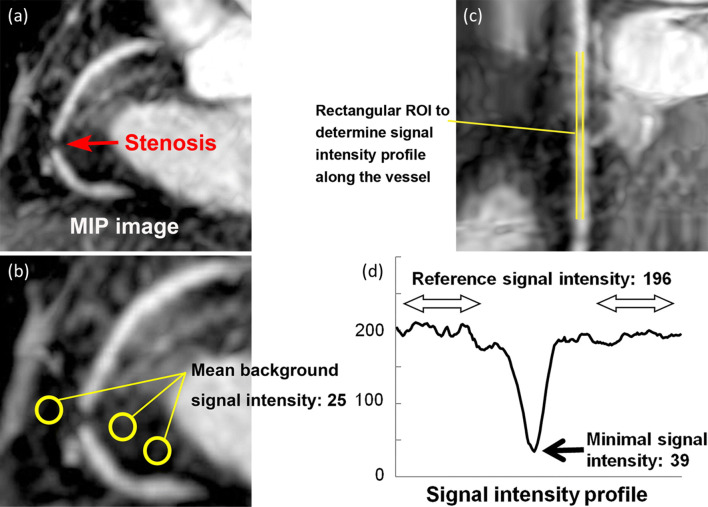
Fig. 8.
QA of narrowing in the coronary artery on the basis of the signal intensity profile along the vessel. a MIP image of the major coronary vessel was generated from a three-dimensional coronary MRA. b Background signal intensity was measured by placing three ROIs (yellow circles) in pericardial fat on the image and averaging signal intensity values in three ROIs. c A stretched multiplanar reconstruction image was reconstructed along the artery, and signal intensity was determined by placing an elongated rectangular ROI with a width of 3 pixels along the vessel lumen (yellow elongated rectangular ROI). A luminal signal-intensity profile was generated after subtracting the background signal intensity. d The percentage stenosis of the coronary artery was determined by measuring the minimal signal intensity at the stenotic lesion and the signal intensity at a reference location without stenosis. In this case, background signal intensity was 25, reference signal intensity was 196 (221–25), minimal signal intensity was 39 (64–25), and percentage stenosis with QA of coronary MRA was 80.1% [1 − (39/196) × 100]. QA quantitative analysis, MIP maximum intensity projection, MRA magnetic resonance angiography, ROI region of interest.
(Reprinted with permission from Yonezawa et al. [119] Copyright © 2013 by RSNA)

