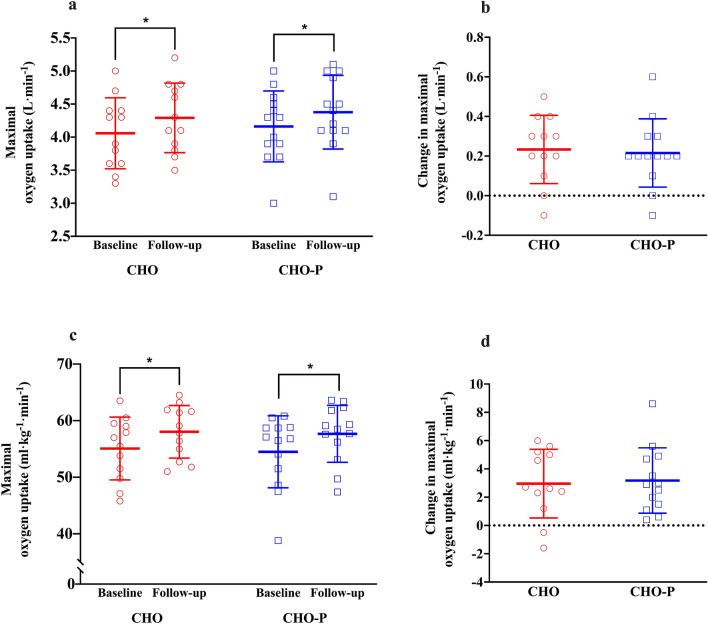
Fig. 3.
Maximal oxygen uptake ()in CHO (n = 12; red coloured) and CHO-P (n = 13; blue coloured) groups. The open symbols represent individual scores; the horizontal and vertical lines represent mean ± standard deviation, respectively. a Absolute scores in L min−1 from baseline to follow-up in both groups; b change in in L min−1 from baseline to follow-up for both groups; c relative scores in mL kg−1 min−1 from baseline to follow-up in both groups; d change in in mL kg−1 min−1 from baseline to follow-up in both groups. *Significant main effect of time compared with baseline (p < 0.01). CHO carbohydrate, CHO-P carbohydrate–protein

