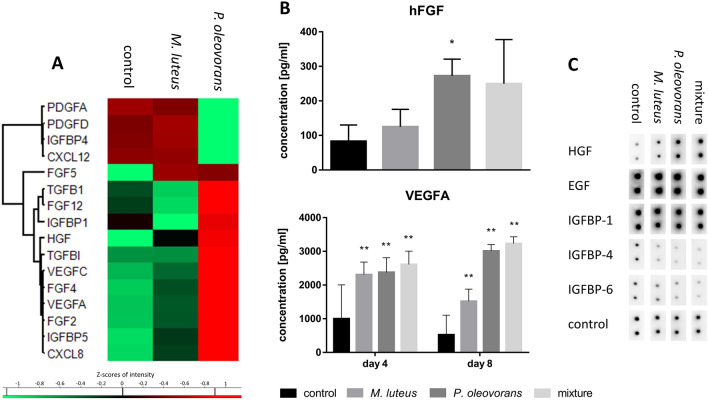
Fig. 4.
Expression of cellular growth factors in microbially competent skin models, colonised as indicated. The cluster map records the transcriptional state at day 8 of microbial colonisation (a). Shown are the gene symbols and Z-scores of significantly differentially expressed genes with an F value < 0.05 across at least three independent experiments. Concomitant excretion of hFGF and VEGFA into the supernatant was quantified using an ELISA (b). Shown are mean concentrations with error bars indicating standard deviation. All values are significant within *p < 0.05 or **p < 0.01. Expression of growth factors into the supernatant was further verified qualitatively using a proteome profiler array (c)

