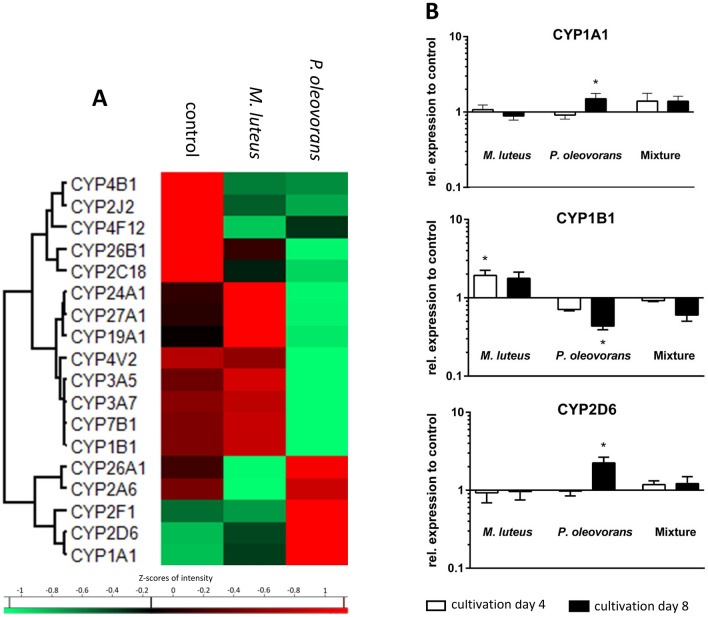
Fig. 5.
Expression of various cytochrome P450-dependent monooxygenases (CYPs) involved in phase I metabolism in the skin with the cluster map recording the transcriptional state at day 8 of microbial colonisation (a). Shown are the gene symbols and Z-scores of significantly differentially expressed genes with an F value < 0.05 across at least three independent experiments. Expression of key transcripts was quantified further using RT-PCR (b)

