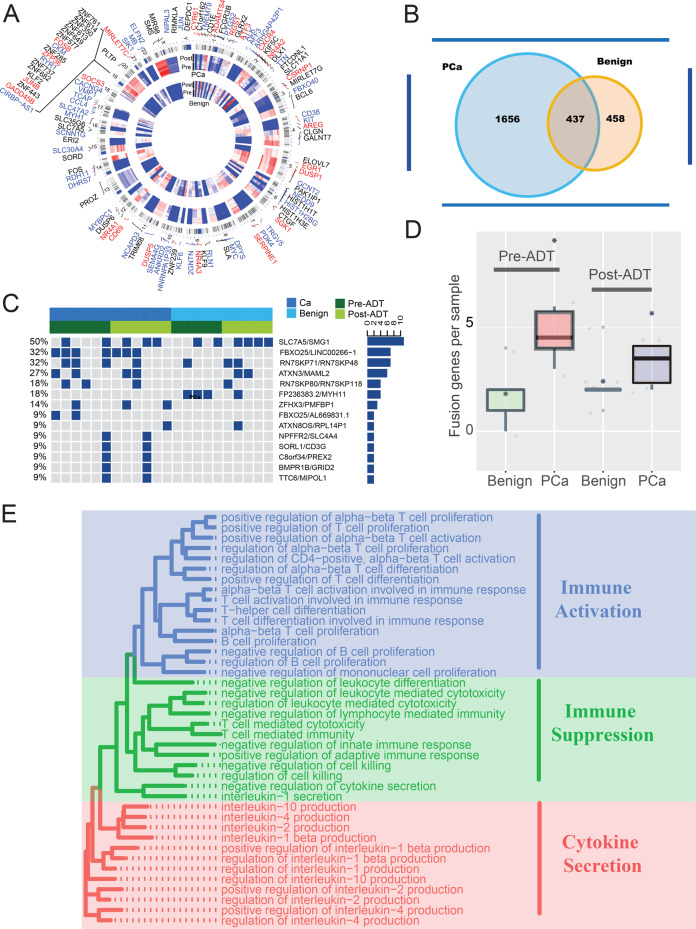
Fig. 1. The transcriptional landscape of PCa and paracancerous benign tissues response to ADT.
a Circular visualization of chromosomal positions for top DEGs 70 genes (top 35 upregulated and 35 downregulated genes) in our PCa and precancerous tissues response to ADT (innermost group: precancerous; outermost group: PCa). Black genes: DEGs in PCa tissues; blue genes: DEGs in precancerous tissues; red genes: represent co-DEGs in both tissues. b Venny diagram of DEGs in PCa and precancerous tissues. c Top 14 most frequency fusion genes in PCa and precancerous tissues pre- or post-ADT. d The box plot shows the number of fusion genes in different groups. e Representative enriched GO functions of DEGs in PCa tissues response to ADT. GO categories are grouped according to functional theme.

