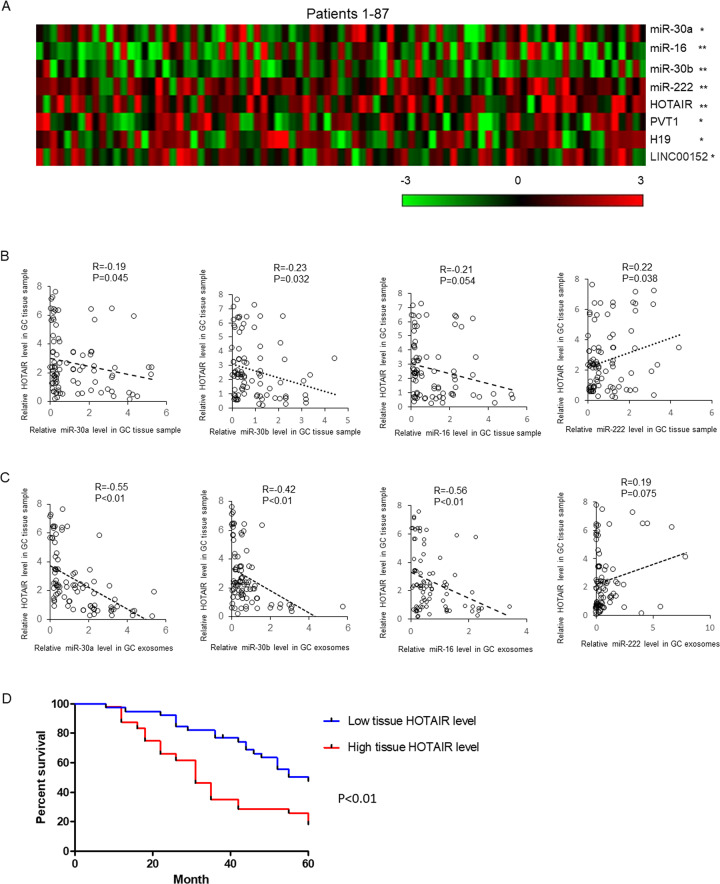
Fig. 2. The level of miRNAs in GC tissue samples and the correlation analysis.
a The expression of four miRNAs and four lncRNAs were detected in GC tissue samples and adjacent normal controls by qRT-PCR. The results were representing as heat map. Results were analyzed by student’s t-test and P < 0.05 was considered statistically significant. *P < 0.05, **P < 0.01. The correlations between tissue HOTAIR level and tissue (b) or plasma exosomal (c) miRNAs’ expressions were analyzed by χ2-analysis. d The overall survival curves are presented according to the expression level of HOTAIR in GC patients.

