
Figure 1.
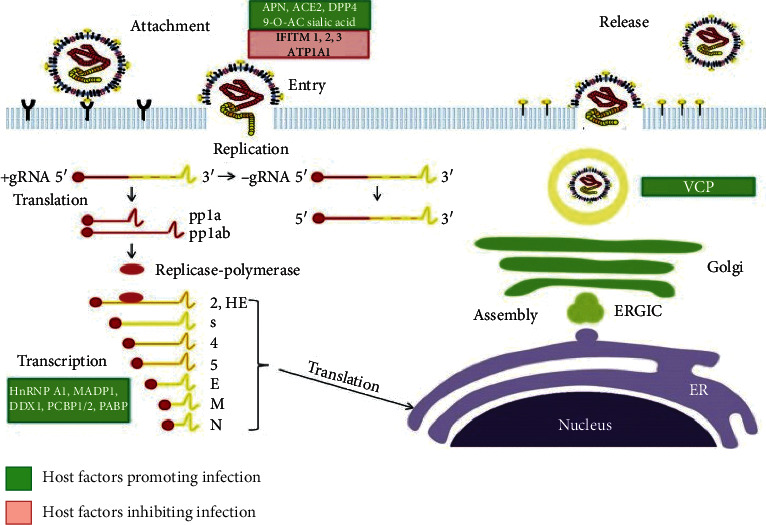
Schematic representation of coronavirus replication cycle (image from Xinyi et al., Diseases 4 (3) (2016): 26; https://www.ncbi.nlm.nih.gov/pmc/articles/PMC5456285/).
Official websites use .gov
A
.gov website belongs to an official
government organization in the United States.
Secure .gov websites use HTTPS
A lock (
) or https:// means you've safely
connected to the .gov website. Share sensitive
information only on official, secure websites.
Schematic representation of coronavirus replication cycle (image from Xinyi et al., Diseases 4 (3) (2016): 26; https://www.ncbi.nlm.nih.gov/pmc/articles/PMC5456285/).