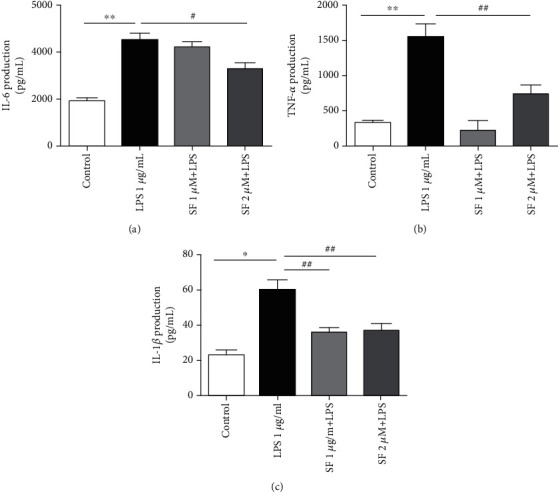
Figure 10.

Effects of SF on the productions of (a) IL-6, (b) TNF-α, and (c) IL-1β in the LPS-stimulated BV-2 cells. The results are expressed as the mean ± SEM (n = 6). ∗∗p < 0.01 as compared with the control group; #p < 0.05 and ##p < 0.01 as compared with the LPS-treated control group.
