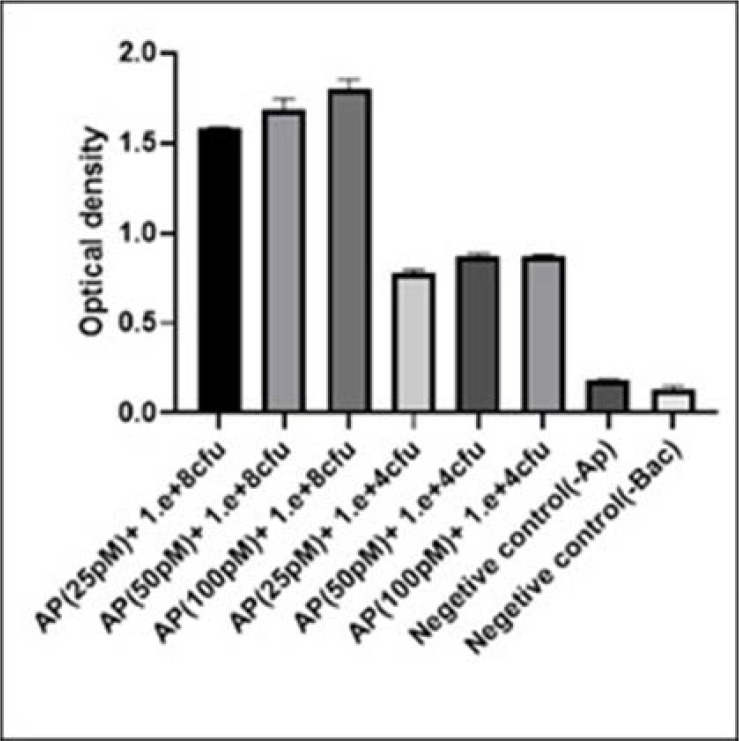
Fig. 5.
Determination of the cut-off value for V. cholerae O1 in the ELASA test. Two different concentration of bacteria (104 and 108 CFU.ml−1) with three different concentration (25, 50, 100 pM) of aptamer V.ch47 were tested in ELASA. The experiment was conducted with two negative controls, one without aptamer and one without bacteria. The bacterial concentration (CFU.ml−1) is shown on the horizontal axis. Error bars display the standard deviation of the OD450 mean of three experiments.

