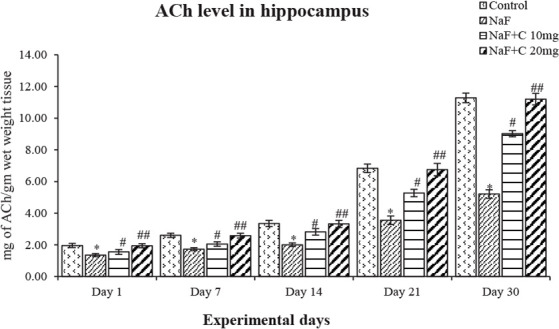
Figure 4.

Acetylcholine levels in the developing hippocampus of the rats treated with sodium fluoride (NaF) and curcumin.
* P<0.05 vs. the control group; #P<0.05 and ## P<0.05 vs. NaF-treated group. Values are expressed as Mean±SEM and the results are reported in mg of ACh/gm wet weight tissue; (n=6).
