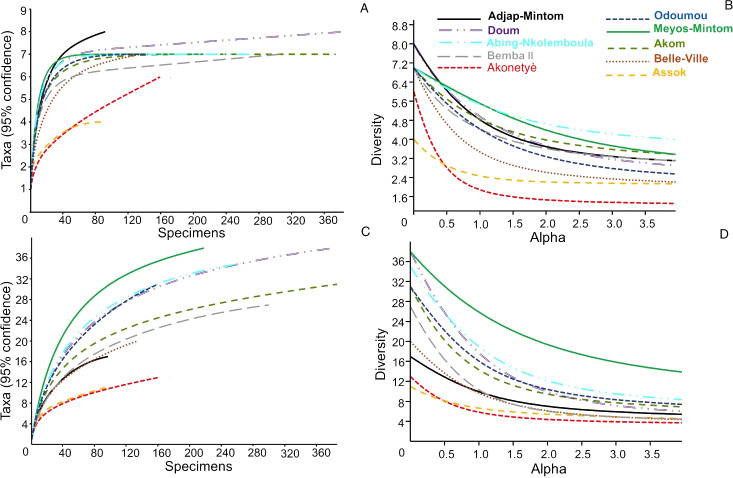
Figure 5. Diversity indices across the 10 villages.
(A, B) Diversity profiles (95% confidence, after 9,999 bootstraps); for the community diversity of hunted animals in surveyed villages. (C, D) Saturation curves (with 95% confidence intervals after 9,999 bootstraps) for the community diversity of hunted animals in surveyed villages.

