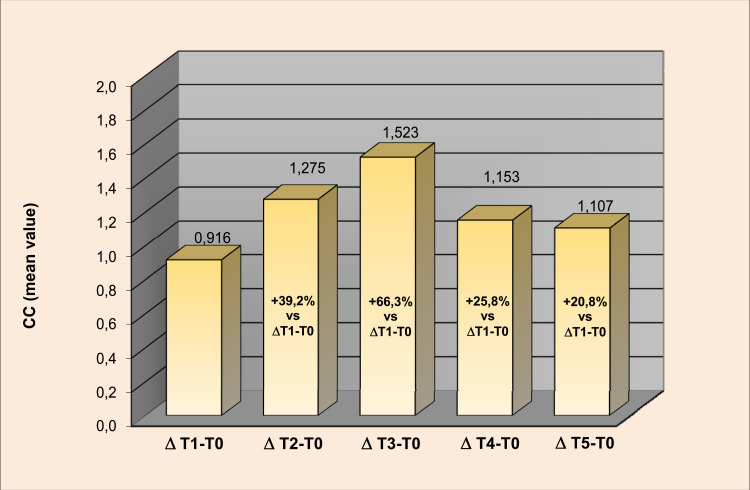
Figure 3.
Instrumental evaluation of cheek volumes by 3D facial volume imaging analysis. The figure shows the change in volume (in cc) at the different time points. The exact figures are reported above the boxes, while the percentages inside each box report the Δ variation for each time point compared to the Δ variation at T1-T0.

