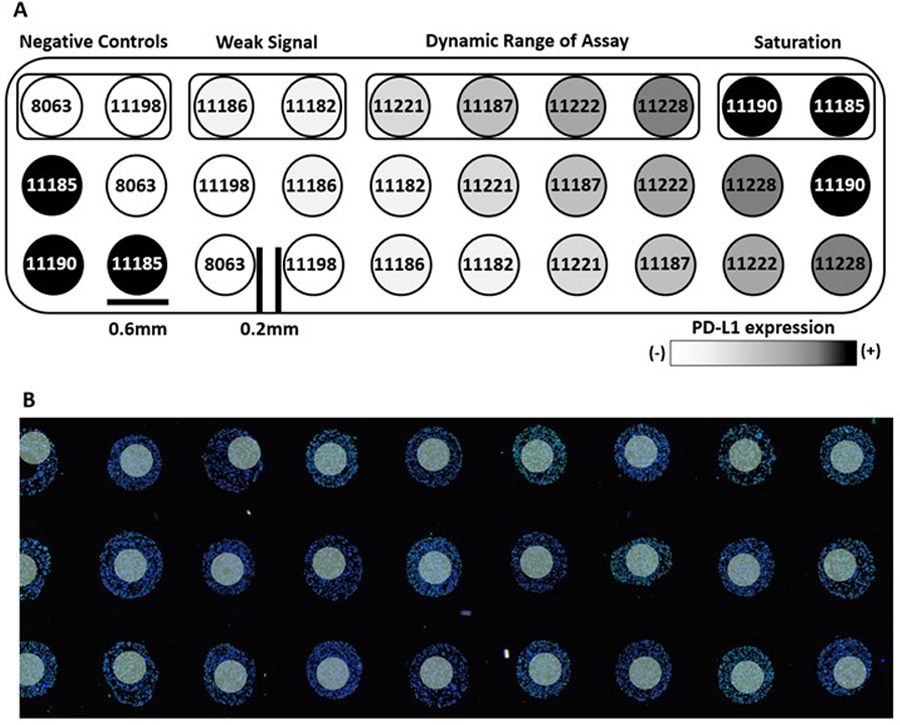
Figure 1: Index TMA layout for PD-L1 quantification.

(A) Schematic map along with ten standardized cell line codes and (B) representative image of the stained standardized TMA and 300um diameter ROIs as white circles.

(A) Schematic map along with ten standardized cell line codes and (B) representative image of the stained standardized TMA and 300um diameter ROIs as white circles.