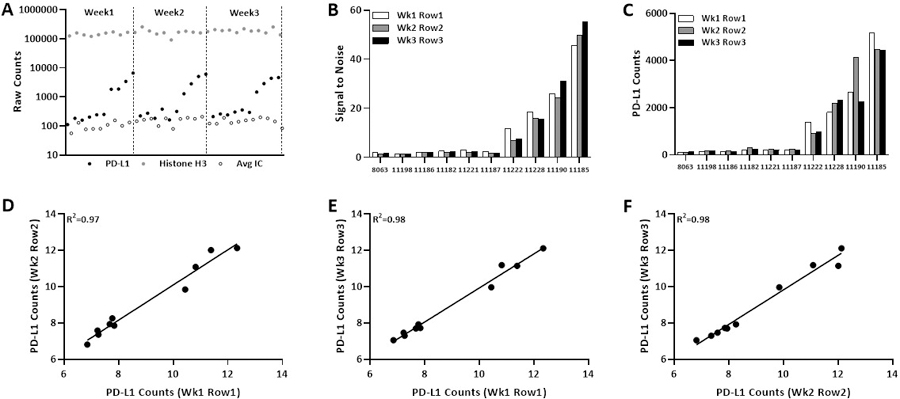
Figure 5: Reproducibility across rows collected one week apart from same staining.

(A) Distribution of PD-L1, Histone H3 and average IC raw counts from all cell pellet collected one week apart. Bar graph show (B) signal to noise ratio and (C) PD-L1 counts for three rows. Regression on Log2 scale for PD-L1 counts (D-E) between two rows collected on different weeks.
