
Fig. 14.
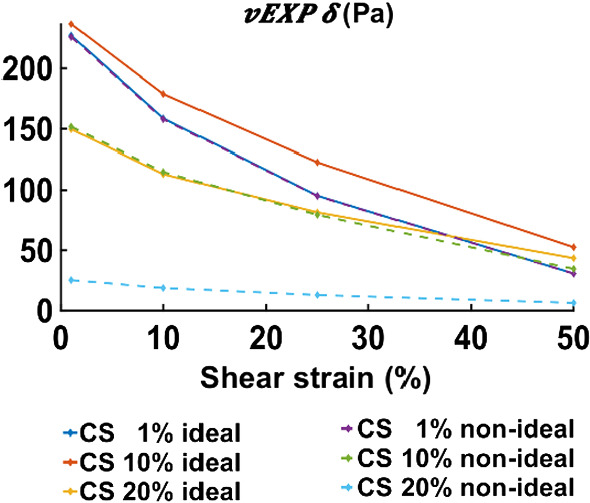
Absolute linear parameters for the vEXP model, corresponding to the data at 1 Hz. The solid lines (blue, orange, yellow) indicate the value of the parameter when using ideal deformation assumption and are the same as the ones presented in Fig. 13, bottom right panel; the dashed lines (purple, green, cyan) indicate the parameter when using non-ideal compression. The non-ideal parameters were obtained by scaling the ideal parameters by the values presented in Table 2