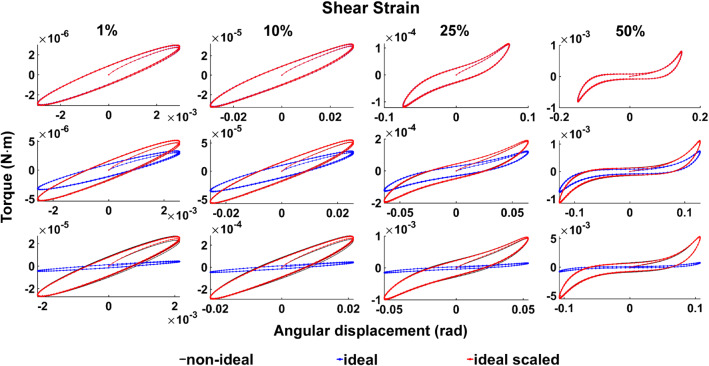
Fig. 19.
Lissajous curves of torque simulations during ideal and non-ideal compression. The simulations were carried out at CS 1% (top row), 10% (second row) and 20% (third row), and shear strain 1% (first column), 10% (second column), 25% (third column) and 50% (fourth column). The black curves show the non-ideal compression, the blue curves show the ideal compression, and the red curves show the scaled ideal compression, using the factors presented in Table 2

