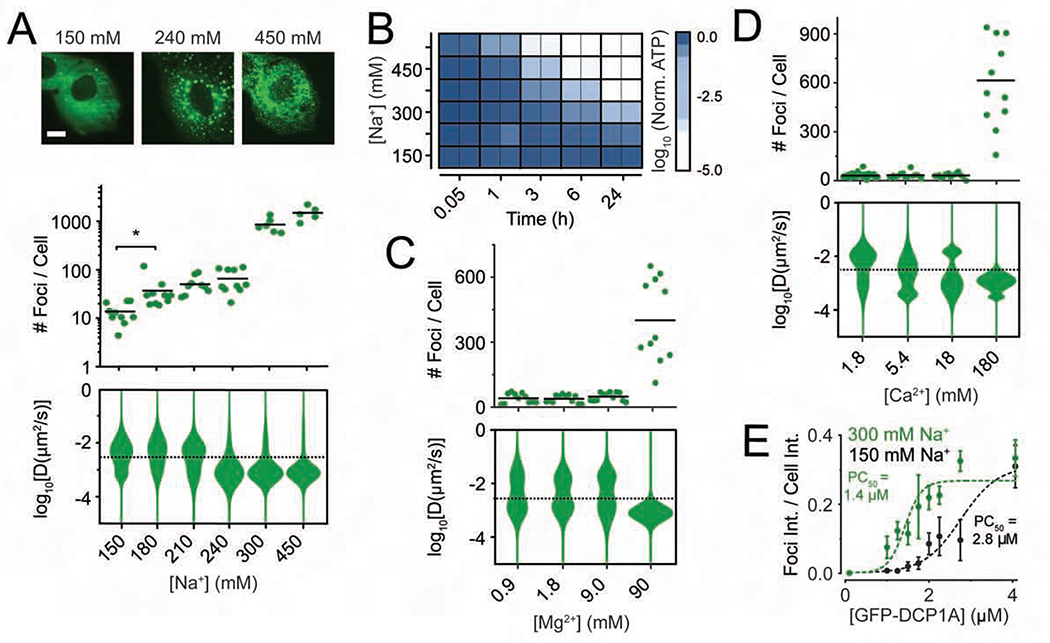
Figure 2. Physicochemical and phenotypic characterization of DCP1A phase separation during hypertonic stress.
(A) Representative pseudocolored images of UGD cells (GFP, green) treated with growth medium containing various concentrations of Na+ (top), scatter plot of the number of foci per cell (middle), violin plots of diffusion constants associated with DCP1A foci (bottom). n = 2, > 5 cells per sample, *p ≤ 0.01 by two-tailed, unpaired Student’s t-test. (B) Representative image of a 96-well plate probed for cell viability by cell-titer glo assay across various Na+ concentrations and multiple time points. n = 3, with technical replicates for each n. (C and D) Scatter plot of the number of foci per cell (top) and violin plots of diffusion constants associated with DCP1A foci (bottom) within UGD cells treated with growth medium containing various levels if Mg2+ (C) or Ca2+ (D). n = 3, > 5 cells per sample. The dotted line in the diffusion plots empirically demarcates high- and low-mobility fractions. (E) Plot of partition coefficient against cellular concentration of DCP1A in samples treated with 150 mM Na+ (light green) or 300 mM Na+ (dark green). Data points were fitted with a dose response curve. PC50 = half maximal partition coefficient. See also Figure S2.

