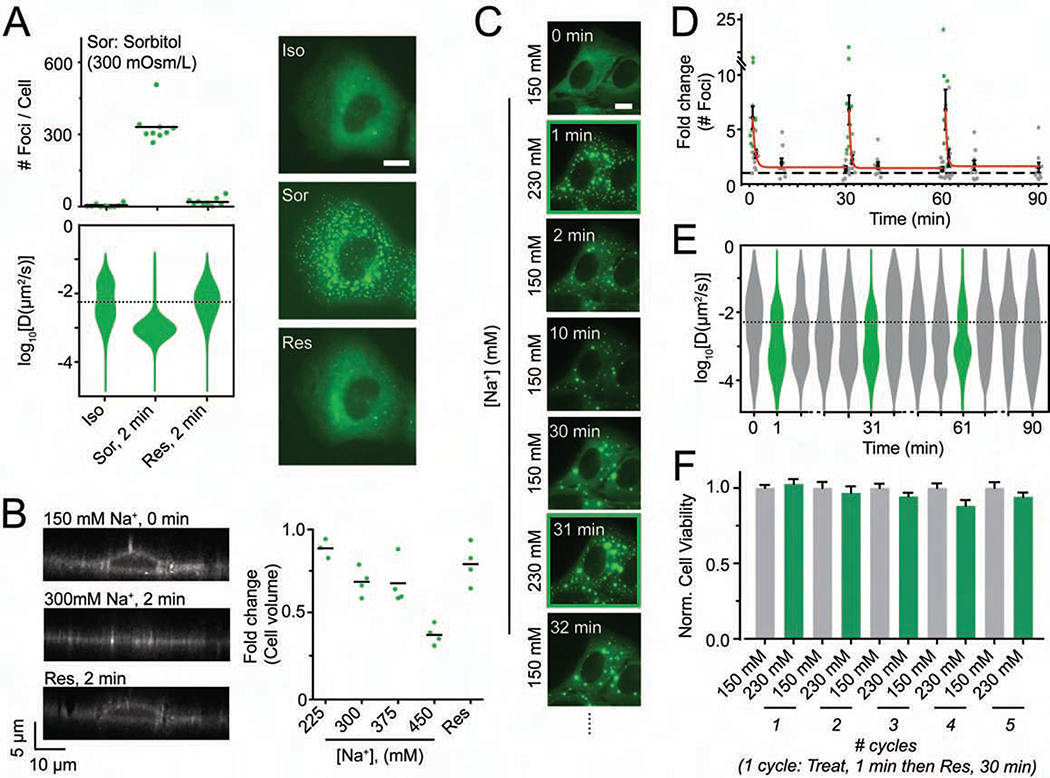
Figure 3. Hyperosmotic compression mediates DCP1A phase separation.
(A) Scatter plot of the number of foci per cell (top), violin plots of diffusion constants associated with DCP1A foci (bottom) and representative pseudocolored images of UGD cells (GFP, green) treated with isosmotic (Iso) growth medium, hyperosmotic growth medium containing the non-ionic osmolyte Sorbitol (Sor), or rescued (Res) with isosmotic medium after Sorbitol treatment. n = 2, > 5 cells per sample. Scale bar, 10 μm. (B) Representative y-z projection of UGD cells (gray-scale) from 3-D imaging assay wherein the cell were treated with isotonic (150 mM Na+) medium, hypertonic (300 mM Na+) medium or rescued with isotonic medium after hypertonic treatment. n = 1, 4 cells per sample. Scale bar, 10 μm. Scatter plot of the fold change in cell volume, as normalized to the cell volume in isotonic conditions, is shown. (C) Representative pseudocolored images of a UGD cell (GFP, green) that was cyclically treated with isotonic (150 mM Na+) or hypertonic (300 mM Na+) medium. Scale bar, 10 μm. (D) Scatter plot of the fold change in foci number, as normalized to foci number in isotonic samples, associated with assay represented in C. Red line depicts exponential fit. n = 2, > 5 cells per sample. (E) Violin plots of diffusion constants associated with DCP1A foci, associated with assay represented in C. n = 2, > 5 cells per sample. The dotted line in the diffusion plots empirically demarcates high- and low-mobility fractions. (F) Bar plots of cell viability, normalized to isotonic samples, associated with assay represented in C. n = 3, with 3 technical replicates for each n. See also Figure S3.

